Who are the best batsmen of each decade?
A look at which batsmen dominated the five-day format, from its start in the late 19th century
Anantha Narayanan
Oct 12, 2019, 1:58 AM
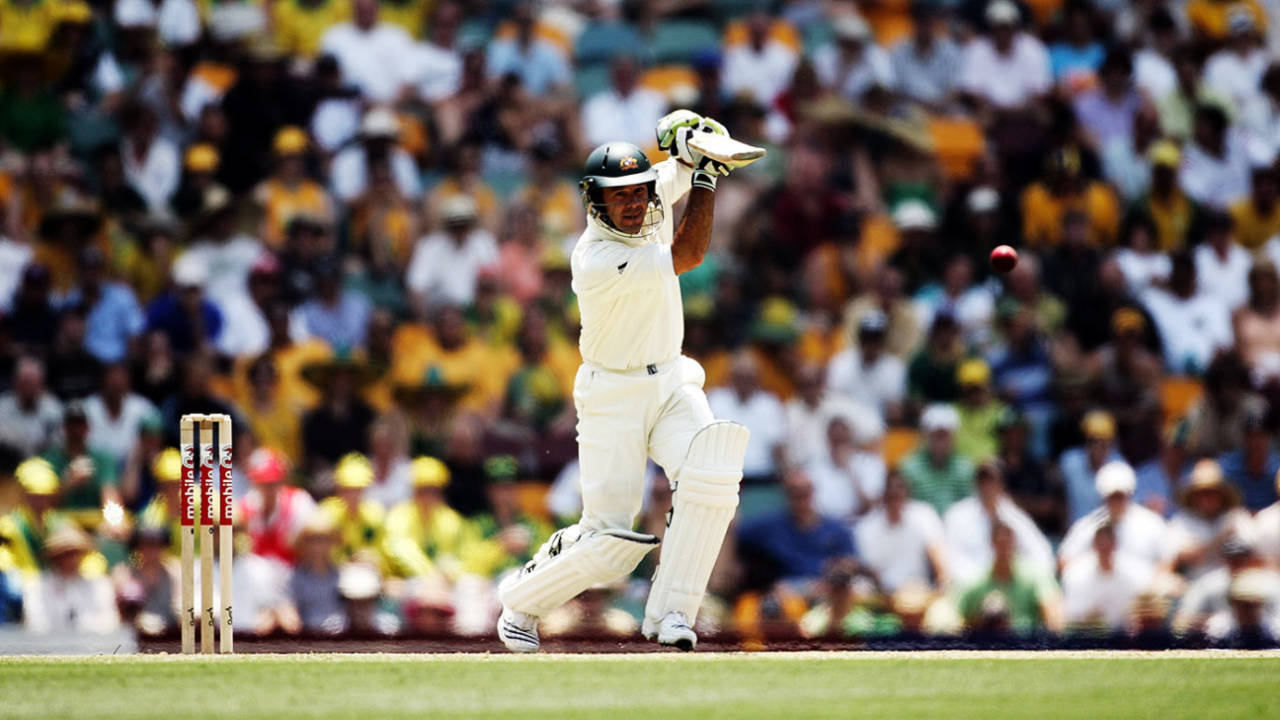
Ricky Ponting: the best Test batsman of the 2000s • Getty Images
This article is in three parts. First, the main article on decade-wise performances by batsmen. Then a brief review of the 2019 Ashes series. And finally, some information on my work on the redesign of my Test performance ratings (an area in which I need readers' inputs).
To start with, an update on the article on best bowlers of each decade. Nick Fisher pointed out that Alan Davidson missed out during the two decades in which he played. Yes, Davidson took 92 wickets at 20.50 in the 1950s and 94 at 20.56 in the 1960s, missing out narrowly on my list. What consistency! That was indeed an astute observation by Nick and my special thanks to him for not saying that I missed this. He trusted my workings and made his derivations based on this belief.
The top batsmen - by decade
For the purposes of this exercise, I will avoid the obviously flawed batting-average metric and instead use my own creation - the Weighted Batting Average (WBA). The WBA, which negates the huge disadvantage faced by top-order batsmen, is calculated as explained below:
For the purposes of this exercise, I will avoid the obviously flawed batting-average metric and instead use my own creation - the Weighted Batting Average (WBA). The WBA, which negates the huge disadvantage faced by top-order batsmen, is calculated as explained below:
- All dismissals, irrespective of the score, count as one innings
- All not-out innings above the average Runs per Innings (RpI) count as one innings
- All not-out innings below the average RpI are assigned proportionate innings values between 0.0 and 1.0 (as a fraction of their average runs per innings)
- The WBA is then calculated using the derived Weighted Innings count
Let me illustrate this using Don Bradman's career. He had ten not-outs, and his scores in those innings were 30, 37, 56, 57, 102, 103, 127, 144, 173 and 299. The last six are above the RpI (87.45) and are considered completed innings. Only the first four are to be prorated. The Weighted Batting Average is 89.61 (6996/78.07).
Now, let me move on to the batsmen who performed well in each decade. The selection criteria are simple. I work with a suitable cut-off (1500 runs for the period between 1877 and 1914, 2000 for the period between 1920 and 1989, and 3000 since 1990). I sequence the selections by WBA. Then, I select the top ten batsmen by WBA and add up to a maximum of ten players by runs scored, taking care to avoid overlaps. In order to increase clarity in crowded areas on the graph, the circle and name are linked by a small dot.
Let us start with the current decade, which is almost over. Steven Smith is the leading batsman, having scored nearly 7000 runs at a WBA of just over 57. Normally many of my batting narratives start with the rhetorical question: "Who is second?" Soon, I think I may have to ask, "Who is third?", implying that only the third and further positions are up for grabs. Look at Smith's numbers:
- An average of 64.5, ahead of the next best, Herbert Sutcliffe, by four runs, and a top batsman, Virat Kohli, by over 12. Because of his 16 not-outs (8% of his total innings), Smith's WBA is down to 57.25, around the levels of the other great batsmen. But he is still in second place to Bradman's 89.61.
- An aggregate of over 100 runs per Test; one of only two batsmen to reach this amazing mark.
- Average rating points per weighted innings of 209, the only batsman other than Bradman to cross 200 points. (Bradman's score was 264.)
Kohli, Joe Root, Kane Williamson, Hashim Amla and David Warner have all scored over 6000 runs and at WBA values between around 45 and 50. The other outliers are Alastair Cook, with nearly 9000 runs, and Kumar Sangakkara, with the best decade WBA value of 58.5.
In the first decade of the millennium, Ricky Ponting was the standout batsman, scoring over 9000 runs at a WBA of just over 53. Mohammad Yousuf had the best WBA value, though with fewer runs. The two Sri Lankan batting greats are clustered in the 7000-8000 runs range, with WBA values above 52. Jacques Kallis and Matthew Hayden scored around 8500 runs at an almost identical WBA of around 50.5. Rahul Dravid and Sachin Tendulkar scored over 7000 runs at WBA values below 50.
Sachin Tendulkar was the batsman of the 1990s: over 5000 runs at a WBA of 53. Brian Lara and Graham Gooch are close behind, with WBAs greater than 50. Steve Waugh scored over 6000 runs but his WBA dropped steeply because of 46 not-outs (17.7%). A few other batsmen have reasonable WBA values but with fewer runs. The cluster at the top is dominated by Ashes batsmen.
Javed Miandad was the best batsman of the 1980s. He scored over 5500 runs at a very good WBA. Greg Chappell, with fewer runs, matched Miandad in WBA. Allan Border had over 7000 runs at a very good WBA of just over 46. Viv Richards had similar WBA figures but with fewer runs. It is nice to see that Kapil Dev qualified.
The 1970s was the decade of Sunil Gavaskar, who stood head and shoulders above the others. He scored nearly 6000 runs at a 53-plus WBA value. Miandad had a WBA value of more than 50 in this decade but scored only around 2000 runs, as did Viv Richards, whose WBA of 56 was among the best by any batsman ever. Greg Chappell and Geoff Boycott performed well.
The 1960s was the decade of two chalk-and-cheese players - Ken Barrington, who scored well over 6000 runs at a WBA of close to 55, and Garry Sobers, who made nearly 5000 runs at a similar WBA. Look at the group of batsmen clustered in the middle. All of them have WBA values around 45 and run totals close to 4000 on either side. A number of batsmen scored above 2000 runs, the qualifying mark.
The next segment is a little over a dozen years. In the 1946-59 period the three great West Indies batsmen, Everton Weekes, Clyde Walcott and Sobers all had WBA values exceeding 50. Len Hutton and Neil Harvey had WBA values nearing 50 and scored many runs. Bradman played for only two years in this period and scored too few runs. It's nice to see Vijay Hazare in this group.
Bradman dominates the 1920-39 period by a mile. Just over 5000 runs at a WBA value just above 90. The daylight between him and the others on the graph is a clear visual indication of where the master stood. Wally Hammond made almost all his aggregate of close to 7000 runs in this double-decade period at an excellent 55-plus WBA value. Sutcliffe had a similar average with fewer runs. George Headley had a WBA value of 60-plus (the only batsman other than Bradman to do this in a decade) but scored only just above 2000 runs.
Jack Hobbs was the leading batsman by a wide margin in the first period of 37 years. He scored well over 2000 runs at a very high WBA of nearly 53. Clem Hill and Victor Trumper scored over 3000 runs in that time but at a sub-40 WBA. But these averages need to be regarded in light of the fact that the pitches were uncovered back then. Most of the other batsmen are nicely clustered around the 2000 runs and sub-30 WBA mark.
A brief review of the Ashes series
S Rajesh analysed the 2019 Ashes series in depth from various points of view and concluded that Australia had the edge in many measures. I have done a comprehensive team-contribution analysis in which I determine the team performance points, incorporating various aspects of the match. My summation of the team performance points for the two sides confirms Rajesh's conclusions: Australia secured 254.7 team performance points to England's 238.9. There were 100 points each on offer for the four result games, and the drawn Test got 93.6. Australia had two comprehensive wins and one close loss. England had one comprehensive win, one very narrow win, and the better of the one draw.
S Rajesh analysed the 2019 Ashes series in depth from various points of view and concluded that Australia had the edge in many measures. I have done a comprehensive team-contribution analysis in which I determine the team performance points, incorporating various aspects of the match. My summation of the team performance points for the two sides confirms Rajesh's conclusions: Australia secured 254.7 team performance points to England's 238.9. There were 100 points each on offer for the four result games, and the drawn Test got 93.6. Australia had two comprehensive wins and one close loss. England had one comprehensive win, one very narrow win, and the better of the one draw.
While Australia might have been marginally ahead on the field, they were tactically way behind the English team.
- Judgement errors: Australia had a DRS success rate of 7.7%, against England's 33.3%
- Selection errors: Mitchell Starc played in one Test and James Pattinson in two, as against Peter Siddle's three Tests
- Tactical errors: Sending England in to bat almost certainly led to the loss of the Oval Test, and the near-loss of the Lord's Test. Also, the last two hours at Headingley were handled poorly in tactical terms. This was partly made up during the last hour at Old Trafford.
The on-field performances made up for these lapses and Australia were able to share the series.
Let me summarise the player performances using the rating points as the yardstick. Smith was the leading batsman, with 3656 points. For England, it was Ben Stokes, with 2149 points. The best bowler on show was Pat Cummins, with 2807 points. Stuart Broad leads the table for England, with 2307 points.
Let us compare these ratings to those from some other Ashes series. Bradman secured 2733 points (810 runs) for his best Ashes series in 1936-37. (Bradman scored 974 runs in 1930 and that was his most prolific series, but that was not his best performance because of a combination of very benign pitches - did Bradman make them appear so? - and some average bowling, Maurice Tate excepted.)
Wally Hammond 's magnificent Ashes outing in 1928-29, when he scored 905 runs, fetched him 2711 points. Jim Laker got 3990 points for his 46 wickets in 1956. Finally, Terry Alderman scored 3979 points with his lbw-dominated haul of 41 wickets in 1989.
Test Ratings: redesign-related points
One formula for all innings is not working, whether it is batting or bowling. The four innings have totally different dynamics. The targets are different (explained below). The pressures are different. The other discipline can be counted on for as long as the third innings is not completed. When Ian Botham batted at Headingley in 1981, he had the small comfort that he and Bob Willis could still turn the tables with the ball in the fourth innings - which Willis indeed went on to do single-handedly. Stokes, 38 years later, did not have that luxury. The partnerships for the ninth and tenth wickets take on different hues in different innings. The Pitch Quality Index (PQI) might vary drastically: 400 and 450 in the first innings does not mean that a chase of 250 in the fourth will be a cakewalk.
One formula for all innings is not working, whether it is batting or bowling. The four innings have totally different dynamics. The targets are different (explained below). The pressures are different. The other discipline can be counted on for as long as the third innings is not completed. When Ian Botham batted at Headingley in 1981, he had the small comfort that he and Bob Willis could still turn the tables with the ball in the fourth innings - which Willis indeed went on to do single-handedly. Stokes, 38 years later, did not have that luxury. The partnerships for the ninth and tenth wickets take on different hues in different innings. The Pitch Quality Index (PQI) might vary drastically: 400 and 450 in the first innings does not mean that a chase of 250 in the fourth will be a cakewalk.
- First-innings target: Totally notional. The match is a clean slate. The team batting first has to aim for a reasonable target, ranging between 300 and 400, depending on the era the game was played in.
- Second innings target: Predominantly notional. At least for this innings, there is a first-innings score in play. In general, against low totals, a substantial lead should be aimed for; against middling totals, aim for parity, and against big totals, to minimise the deficit. Still, quite a lot is up for grabs.
- Third innings target: Part notional, part actual. We now have a much clearer picture. There is a deficit or lead on the table. Depending on what has happened in the two innings so far, the objective is to set the team batting fourth a reasonable target - say from 200 to 400-plus.
- Fourth innings target: This is set in stone. Fortunately there is no DLS to contend with. A secondary target might be time-related. However, the run target is very clear - it ranges from 1 to 835.
The first two innings are difficult to evaluate. How does one value two great innings, such as Virender Sehwag's 201 not out and Steven Smith's 144 relative to each other? Both were once-in-a-lifetime gems, invaluable, and set up wins in difficult away conditions. It is unfair to say that Kusal Perera (in Durban earlier this year), and Stokes and Botham at Headingley, had all the pressure in the world and Sehwag and Smith did not. I consider Sehwag's and Smith's innings as no less than those of Perera and Stokes, but lingering doubts remain. While I think I have managed to have a single set of parameters, valuations and calculations across all innings, I realise that there are many questions that are difficult to answer. My overriding need to be fair across innings has resulted in some shortcomings in evaluation, especially of innings in the latter half of matches.
Match status has a different connotation when the target is a firm one (as in the fourth innings) or a totally notional one (as in the first innings). As the match moves towards its close, the stark facts behind the resources remaining comes into play. The winning percentage values, which I develop for the third and fourth innings, do not exist in the first- and second-innings computations.
The inescapable conclusion is that there is a clear need to have separate ratings for first and second innings and third and fourth innings, with their own independent parameters. It is also certain that the weight allocation will vary considerably. The contrast between setting up the match and concluding the match has to be incorporated. And of course, three-innings matches, such as innings wins, have to be properly taken care of.
Presentation: I have had major problems in the presentation of data in both Golden Willow 25 and Red Cherry 25 tables. When the tenth-placed performance secures 788 points and the 20th gets 759 points, they are only 29 points (3.7%) apart, but readers make a fuss about the difference in rank and talk as if the 20th-placed innings is very poorly placed. They fail to understand that these are tenth and 20th places among 80,000-plus innings. The other problem is that readers often compare two closely placed innings, say, which received 764 and 763 points respectively, asking how I can rate one higher than the other, little realising that the one-point difference could be caused by a fourth-decimal-place difference in any one parameter.
Readers should understand and accept the beautiful maxim "first among equals". They should understand that the innings of Perera, Graham Gooch, Sanath Jayasuriya, Bradman and Azhar Mahmood are the current top five innings ever played and Perera's is first among equals. Since it is unlikely that most readers will accept and understand this concept voluntarily, I may have to only present groups of innings in future. Maybe by giving each innings a finite ratings value, I might have implied that Perera's was a better innings than Gooch's and so on. Let me put paid to that. I could instead potentially have, say, four groups of five innings each for the top 25, instead of a serially ranked list. Within each group of five, I might present the innings in chronological or alphabetical order only, so that no inferences are drawn about where each ranks alongside its peers.
I would really like readers to comment on these far-reaching suggestions, and the specific points mentioned below:
1. Use PQI for first and second innings and third and fourth separately, as against the current method of using the PQI-Match.
| Test | PQI-Match | PQI-1/2 | PQI-3/4 | Scores (1-2) | Scores (3-4) | Summary |
|---|---|---|---|---|---|---|
| Eng v Aus, Headingley, 2019 | 37.0 | 20.2 | 53.3 | 179 and 67 | 246 and 362/9 | Improved significantly |
| NZ v SL, Christchurch, 2018-19 | 50.1 | 22.2 | 76.3 | 178 and 104 | 585/4 and 236 | Improved drastically |
| Eng v WI, Headingley, 1976 | 49.6 | 62.3 | 32.9 | 450 and 387 | 196 and 204 | Deteriorated significantly |
| WI v NZ, Antigua, 1995-96 | 59.8 | 76.5 | 34.6 | 548/7 and 435 | 184 and 130/5 | Deteriorated drastically |
2. Split CTD_Away (Career-to-date away) into CTD_Asia and CTD_Others in all away workings. The following statements are self-explanatory.
- Murali: 307 @ 27.8 Away, but 119 @ 30.5 in Asia and 188 @ 26.1 in other countries
- Walsh: 290 @ 25.0 Away, but 77 @ 20.5 in Asia and 213 @ 26.7 in other countries
- Lara: 5736 @ 47.8 Away, but 1530 @ 58.9 in Asia and 4206 @ 44.7 in other countries
- Saleem Malik: 2860 @ 39.2 Away, but 752 @ 31.3 in Asia and 2108 @ 43.0 in other countries
3. Introduce Recent Form (last ten innings or spells) while determining player quality. The RF will carry 33.33% weight as against the 66.67% for career-to-date values. The RF will be based on runs scored and wickets taken (and not the averages). Sufficient care will be taken to ensure that the RF values do reflect "recent" periods. This is a tough algorithm, since Tests were played at different frequencies during different eras.
There was a suggestion that the Recent Form should look forward and include Tests until the end of the series. This is a brilliant suggestion. Cummins' Recent Form in Ashes series, if tweaked to include his 29 wickets at 19.6, would go a long way in establishing how he bowled during the early Tests. Similarly for Broad. And in the case of Jofra Archer, this will be very meaningful since he does not have any Recent Form because he made his debut in the series, at Lord's. The forward look will anoint his status as a leading bowler for England through the entire series.
However, there is a minor problem to contend with. When the ratings work is done at the end of the Test, an innings/spell might get a ratings value that might change as we progress towards the end of the series. But this is only a minor point, since the values will get set at the end of the series. This suggestion deserves serious consideration.
4. Strengthen Bowling Quality faced parameter. Take in a combination of "four best bowlers who took the field" and "the bowlers who bowled in the innings". Decide on the proportion by doing a bit of AI work. (If James Anderson bowls only four overs, lean more on the latter value; if there is no discernible shortfall, lean on the former value.) If Broad and Chris Woakes run through Ireland in 16 overs, the bowling-quality parameter should reflect primarily these two bowlers. Of course, each of these options will have a minimum weight of 25%.
5. Rationalise Innings size points, taking into account redundancy and slack.
| Test | Batsman | Score | Target | Actual | Won by | Summary |
|---|---|---|---|---|---|---|
| Pak v SL, Faisalabad, 2004-05 | Sanath Jayasuriya | 253 | 321 | 438 | 201 runs | Redundancy |
| Eng v Aus, Trent Bridge, 2013 | Ian Bell | 109 | 365 | 375 | 24 runs | Not much redundancy |
| Aus v SA, Sydney, 1993-94 | Jonty Rhodes | 76 | 373 | 239 | 5 runs | Absolutely no redundancy |
We have to recognise that in Faisalabad, Sanath Jayasuriya might well have scored 100 runs fewer and Sri Lanka could still have won. But in Sydney in 1993-94, Jonty Rhodes needed to score every single one of those 76 runs. This should have some impact but not necessarily very high.
6. Factor in the margin of result, especially in losses. Reward performances in close losses, both bowling and batting, in third and fourth innings. For example:
Reward Labuschagne (80), Hazlewood (4 for 85) at Headingley, 2019
Reward Langer (54), Tim May (5 for 9) in Adelaide, 1992-93
Reward Azhar Ali (65), Yasir Shah (5 for 110) in Abu Dhabi, 2018-19
Reward Ryder (87), Oxenham (4 for 67) in Adelaide, 1928-29
Reward Langer (54), Tim May (5 for 9) in Adelaide, 1992-93
Reward Azhar Ali (65), Yasir Shah (5 for 110) in Abu Dhabi, 2018-19
Reward Ryder (87), Oxenham (4 for 67) in Adelaide, 1928-29
7. Analyse partnerships more in depth and more effectively.
- Top-order partnerships. Let us consider two partnerships. KL Rahul and Rishabh Pant came together at 121 for 5 at The Oval last year and added 204 runs. Despite India's ultimate loss, this has to be given a very high degree of recognition. A few months later, in Rajkot, Kohli and Pant came in at 337 for 4 and added 133. There was no pressure and this partnership does not require any special recognition.
- Incorporate Win% values while determining the match status at the beginning and end of the partnership. This will be applicable for the third and fourth innings. For the first and second innings, a comparison to the target (primarily notional) should suffice.
- For points 7 and 8, work out a complete snapshot of the innings, incorporating whatever data is available.
8. Completely rework the processing of the late order of the innings. This is the most important change. There is a need for a clear treatment of each of the late-order partnerships, starting from the sixth wicket onwards. We have to strongly reward ninth- and tenth-wicket partnerships, especially in the third and fourth innings. Botham, Perera and Stokes should get a lot of credit, but also their partners. Today, Graham Dilley, Vishwa Fernando and Jack Leach are not rewarded properly. Smith (and Siddle) should also get a lot of credit, but probably less than the third- and fourth-innings heroes.
9. X-Factor to be introduced. I have given below a non-exhaustive list of factors that could be considered.
- Winning after follow-on. Recognise the only three instances in the history of Test cricket
- Recognise tied matches - only two occurrences in the history of Test cricket
- Recognise great defensive innings - Dennis Amiss' 262 not out, Mike Atherton's 185 not out, etc
- Responding after scoring a very low total (67) or facing a huge total (595/586)
- Special situations such as Ashes/winning streaks at stake (but not necessarily the series), mass exodus of players, etc
- Important World Test Championship match - especially in the later stages and the final
- Take series situation into account
- Possibly recognise a hat-trick - it has occurred only 44 times in 142 years
- An epochal win by a new team very early in their existence - Pakistan v England in 1954, Afghanistan v Bangladesh in 2019, etc
- Allow for manual input since some of the above cannot be gleaned from the scorecard
Email me with your comments and I will respond. This email id is to be used only for posting comments.
A simple request to readers. The invitation to comment is made in good faith. If you do not respect me or my work, or you want to rant against specific players, or show off, or you have chips on your shoulders, please do not send vitriolic emails wasting your time and mine. Your mail will go where it belongs - to the trash or spam folder.
Anantha Narayanan has written for ESPNcricinfo and CastrolCricket and worked with a number of companies on their cricket performance ratings-related systems