The Kohli and Root show
The 2016 World T20 saw some fine batting, but Kohli and Root stood out not just for the runs they scored, but the manner in which they got them
S Rajesh
Apr 8, 2016, 3:10 AM
There were other batsmen who starred in an innings or two, but over the entire tournament Virat Kohli and Joe Root were the best of the lot • ESPNcricinfo Ltd
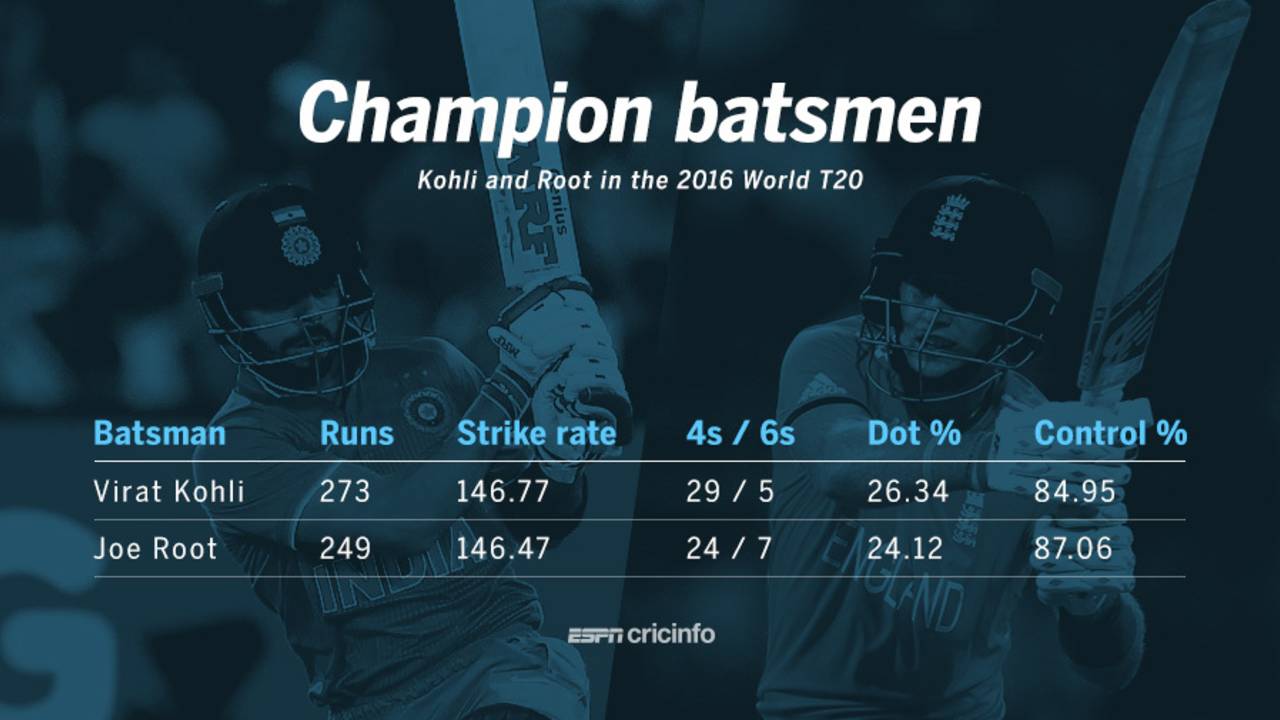
Many batting feats stood out in the recently concluded World T20 - Carlos Brathwaite's four sixes in four successive balls was the most memorable, no doubt, but there were also hundreds for Chris Gayle and Tamim Iqbal, and other worthy performances by Martin Guptill, Jos Buttler, Marlon Samuels, Mohammad Shahzad, among several others. In terms of consistency and sheer class of batsmanship, though, it's difficult to look beyond Virat Kohli and Joe Root, the leading run-getters in the tournament from the Super 10 stage onwards.
Kohli passed 20 in each of his five innings and had a lowest score of 23, while Root was dismissed before 20 only once - run out for 12 against Afghanistan - in six innings.
Kohli was obviously the bigger star in chases - he does them better than anyone else - and twice led the batting in tricky chases against Pakistan and Australia. However, Root didn't do badly when batting second either, scoring 83 off 44 to help England overhaul 229 against South Africa.
Apart from the bucketload of runs they scored, there was also an orthodoxy and calmness in their approach that stood out, in a format where most others resort to a frenetic, unorthodox methods. Their strike rates were outstanding and remarkably similar - the difference was 0.3 - and they scored at nearly 150 runs per 100 balls by playing mostly orthodox cricket shots, and unerringly picking the gaps in the field. Neither is a big six hitter, which is reflected in the fact that both hit fewer than ten sixes in the tournament, and scored fewer than 20% of their runs in sixes. The others among the top five run-getters in the entire tournament hit at least 12 sixes. The percentage of runs in boundaries is similar for both as well.
Though the strike rates were similar, Root's runs came in high-scoring games, in which the average strike rate of all batsmen was 137; in the matches that Kohli played, the average was only 119. That means the strike-rate factor (which is the batsman's strike rate divided by the rate of all batsmen excluding him in these matches) was much better for Kohli than for Root.
| Batsman | Runs | Runs/inngs | Strike rate | SR factor | 4s/ 6s | % runs in 6s | % runs in bound |
| Virat Kohli | 273 | 54.60 | 146.77 | 1.29 | 29/ 5 | 10.98 | 53.48 |
| Joe Root | 249 | 41.50 | 146.47 | 1.08 | 24/ 7 | 16.87 | 55.42 |
Apart from their shot selection and impeccable placement, another aspect of their batting that stood out was their ability to make every ball count; if a boundary wasn't possible, they still picked the gaps and ran hard. That is reflected in the dot-ball percentages of these batsmen when compared with others in the tournament. Among all batsmen who faced at least 75 balls in the tournament, the dot percentages for Root and Kohli were the lowest. Some of the other big names in the tournament either had a tough time keeping the dots down, or simply didn't care about them - the percentages were 46 for Rohit Sharma and Kane Williamson, 43 for Guptill and 41 for Gayle - but Kohli and Root worked the ball around expertly, even when they weren't hitting the boundaries.
| Batsman | Runs | Balls | SR | Ave | dot% |
| Joe Root | 249 | 170 | 146.47 | 62.25 | 24.12 |
| Virat Kohli | 273 | 186 | 146.77 | 136.50 | 26.34 |
| Mohammad Nabi | 105 | 80 | 131.25 | 21.00 | 27.50 |
| Samiullah Shenwari | 122 | 95 | 128.42 | 24.40 | 29.47 |
| Jos Buttler | 191 | 120 | 159.16 | 47.75 | 30.00 |
| Shakib Al Hasan | 129 | 102 | 126.47 | 32.25 | 32.35 |
| Glenn Maxwell | 109 | 84 | 129.76 | 27.25 | 33.33 |
| Hashim Amla | 120 | 89 | 134.83 | 60.00 | 34.83 |
The run-scoring patterns for the two in the tournament had some similarities and some differences. Both preferred the midwicket region more than any other, but Root scored a much bigger chunk of his runs there - more than 35%, compared to Kohli's 24%. Both scored more than 110 runs in the midwicket and mid-on region, but Kohli was more prolific in the V, scoring 79 of his 273 runs through mid-off and mid-on, compared to just 45 for Root. Kohli's spread of runs on either side of the wicket was also far more even - 47% on the off side, and 53 on the leg side - compared to Root, who scored only 34% on the off side, and 66% through the leg side.
| Virat Kohli | Joe Root | |||
| Region | Runs | Percentage | Runs | Percentage |
| Third man | 17 | 6.23 | 17 | 6.83 |
| Point | 38 | 13.92 | 24 | 9.64 |
| Cover | 45 | 16.48 | 32 | 12.85 |
| Mid-off | 28 | 10.26 | 12 | 4.82 |
| Mid-on | 51 | 18.68 | 33 | 13.25 |
| Midwicket | 65 | 23.81 | 89 | 35.74 |
| Square leg | 23 | 8.42 | 18 | 7.23 |
| Fine leg | 6 | 2.20 | 24 | 9.64 |
The other number that stood out for both Kohli and Root was their control factor, a number that indicates the extent to which they were in control of their shots, and how often they were beaten or mistimed their shots. The 20-over format necessitates batsmen to go for big shots and take chances, which is why control factors are normally lower for batsmen than they are in the longer forms of the game.
In the entire tournament, the overall control factor for all batsmen was 74%. Since the start of the Super 10s, it was 75%. Both Root and Kohli were well above that mark: Kohli's was very nearly 85%, and Root's was 87%. Most other batsmen struggled to hit the 80s: Williamson, Rohit, Steven Smith, Buttler and Tamim - who was the leading run scorer over the entire tournament - had control factors of 77-78%, while Jason Roy's was only 68%, despite him being the sixth-highest run scorer in the tournament. Samuels touched 80%, while Guptill did even better, with a control factor of 84%. That Kohli and Root scored so many runs with such consistency, and did so with such a high control factor, indicates the level at which they were batting through the World T20.
| Batsman | In control | Not in control | Control % |
| Joe Root | 148 | 22 | 87.06 |
| Virat Kohli | 158 | 28 | 84.95 |
Given the sort of form that both Kohli and Root have been in over the last year and more, it wasn't much of a surprise that they racked up the sort of numbers they did in the World T20. Along with Williamson and Smith, they are clearly the batsmen for the future.
The current numbers for both Kohli and Root are impressive across formats, and both have shown several times that they can adapt to different forms of the game pretty easily. A comparison of their averages in different formats is interesting, though. Root's stats are pretty conventional - he averages the highest in Tests, followed by ODIs and then T20Is. With Kohli, though, the order is reversed. His average in T20Is is the highest, followed by ODIs and then Tests. The shorter format numbers are incredible, but Kohli will want that Test average of 44.02 to get closer to Root's 54.93. Root, meanwhile, has clearly made himself the batsman that opposition bowlers will focus most attention on, regardless of the format.
| Format | Mat | Runs | Ave | SR | 100s | 50s |
| Tests | 39 | 3406 | 54.93 | 53.52 | 9 | 19 |
| ODIs | 68 | 2572 | 44.34 | 84.46 | 8 | 12 |
| T20Is | 20 | 594 | 39.60 | 138.78 | 0 | 4 |
| Format | Mat | Runs | Ave | SR | 100s | 50s |
| Tests | 41 | 2994 | 44.02 | 52.92 | 11 | 12 |
| ODIs | 171 | 7212 | 51.51 | 89.97 | 25 | 36 |
| T20Is | 43 | 1641 | 58.60 | 135.17 | 0 | 16 |
S Rajesh is stats editor of ESPNcricinfo. Follow him on Twitter