Why Nathan Lyon is special
Fingerspinners have generally struggled in Australia, but Nathan Lyon has been a glorious exception
S Rajesh
01-Dec-2017
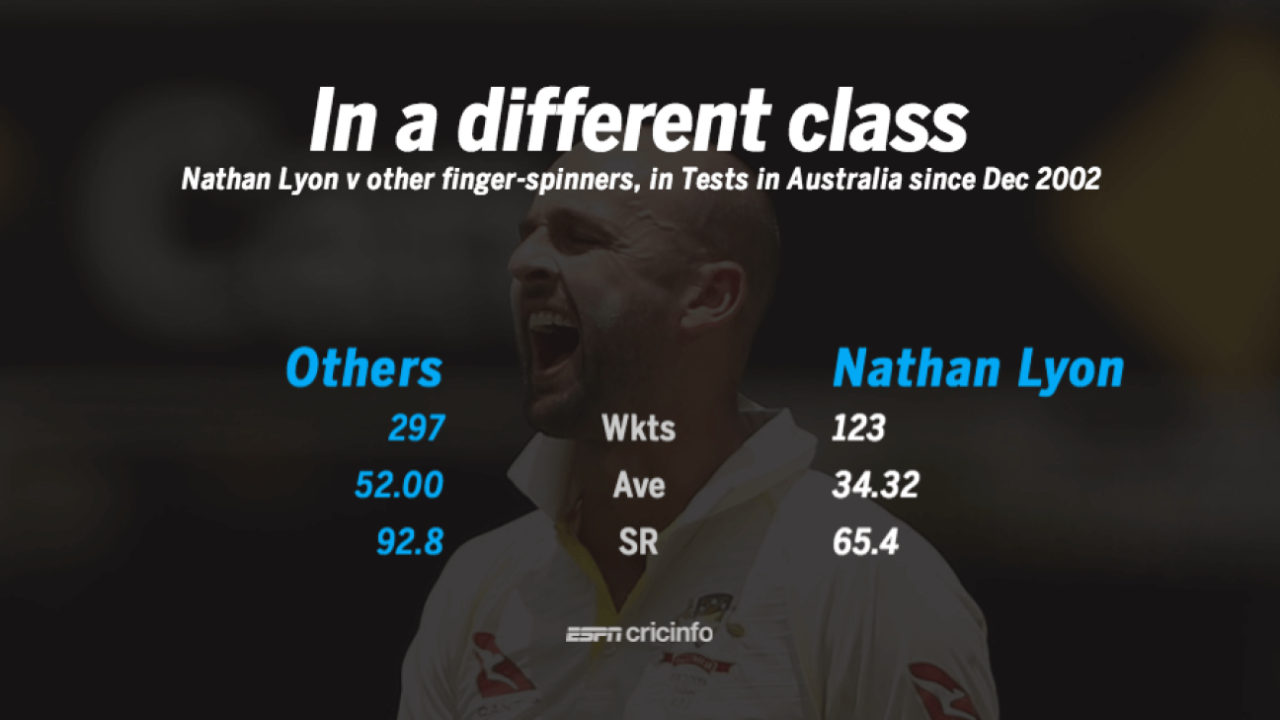
Nathan Lyon's numbers are much better compared to those of other fingerspinners in Australia over the last 15 years • ESPNcricinfo Ltd
In his post-match review of the Brisbane Test, Graeme Swann was somewhat dismissive of Nathan Lyon's efforts in the match. "Lyon's got a lot of plaudits for how well he bowled in this game, but England actually didn't capitulate to Lyon. He got 5 for 150 [145] in the game. That's a fairly average return on a wicket that was turning square and bouncing."
Swann was probably batting a bit for his country and his former team-mates, but for most of the pundits who watched the game, Lyon was outstanding at the Gabba, especially in England's first innings. He only managed figures of 2 for 78, but he went past the bat on numerous occasions and created plenty of chances, and his 36 overs allowed the fast bowlers a fair amount of rest in an innings that lasted 117 overs. While his overall figures of 5 for 145 do scant justice to the way he bowled, the stat that illustrates his bowling better is the control factor, which is the number of times he drew a false shot from a batsman (when the batsman was beaten, or he edged or mistimed his shot). Lyon forced 67 such mistakes from the batsmen in the match, the highest among bowlers from either team. In percentage terms, only Pat Cummins drew a higher percentage of errors (19.9) than Lyon's 18.6%.
| Bowler | Balls | Not-in-control | NIC% |
| Pat Cummins | 256 | 51 | 19.92 |
| Nathan Lyon | 360 | 67 | 18.61 |
| Mitchell Starc | 264 | 42 | 15.91 |
| James Anderson | 239 | 37 | 15.48 |
| Jake Ball | 156 | 23 | 14.74 |
| Stuart Broad | 210 | 27 | 12.86 |
| Josh Hazlewood | 232 | 29 | 12.50 |
| Moeen Ali | 204 | 20 | 9.80 |
| Chris Woakes | 210 | 17 | 8.10 |
Bowling fingerspin in Australia has always been considered one of the challenging tasks in Test cricket. The pitches are hard, unforgiving, and don't usually offer a lot of turn, and the bounce usually available is easier to exploit for a wristspinner. It is not surprising that the two spinners who have taken more Test wickets in Australia than Lyon in the last 25 years are both wristspinners: Shane Warne (318) and Stuart MacGill (135).
Lyon averages 34.32 in Australia (against a career average of 31.78), but when compared with how other fingerspinners have fared here over the last 15 years, those numbers are highly impressive. In the last 15 years (since December 1, 2002), all fingerspinners (including Lyon) have averaged 46.59 runs per wicket in Tests in Australia, the worst among the countries that have hosted more than 30 or more Tests during this period. (Excluding Lyon, that average goes up to 52.) South Africa comes a close second at 43.51, while the average in all other countries is less than 40.
| Host | Fingerspin - Wkts | Ave | Offspin - Wkts | Ave |
| Australia | 420 | 46.59 | 277 | 46.83 |
| South Africa | 316 | 43.51 | 141 | 47.78 |
| New Zealand | 344 | 39.09 | 150 | 36.99 |
| England | 606 | 35.84 | 368 | 34.16 |
| West Indies | 520 | 35.78 | 361 | 33.73 |
| UAE | 333 | 35.05 | 168 | 37.36 |
| Bangladesh | 684 | 34.52 | 284 | 34.88 |
| India | 1018 | 32.14 | 638 | 32.57 |
| Sri Lanka | 1086 | 31.08 | 658 | 30.47 |
Lyon's ability to extract bounce from the Australian pitches has served him well against all batsmen, but especially against right-handers, as it gives him an extra wicket-taking option of defeating batsmen with the bounce and having them caught by the close-in leg-side fielders. In other countries, Lyon averages almost 34 against right-handers and 23 against left-handers; in Australia, the average against right-handers goes up only marginally, to 36, while against left-handers it increases to 29, a rise of about 28%.
| Home/away | RHB-Wkts | Ave | LHB-wkts | Ave |
| Home | 89 | 36.22 | 34 | 29.26 |
| Away | 96 | 33.65 | 55 | 22.83 |
| Overall | 185 | 34.89 | 89 | 25.29 |
A comparison of the stats for other offspinners in Australia over the last 15 years shows just how good Lyon has been in tough bowling conditions over a fairly long period of time. Nathan Hauritz averages less than 30, but he played only nine Tests in Australia. The other big guns have all struggled here: Swann and R Ashwin average in the 50s, while Harbhajan Singh and Muttiah Muralitharan go beyond 60. Also, apart from Hauritz, all of them have much poorer numbers against right-handers. Ashwin, for example, averages 30.41 against left-handers, and 87 against the righties.
| Bowler | Overall-wkts | Ave | v RHB-wkts | Ave |
| Nathan Hauritz | 38 | 29.65 | 26 | 26.23 |
| Graeme Swann | 22 | 52.59 | 11 | 57.55 |
| R Ashwin | 21 | 54.71 | 9 | 87.11 |
| Mark Craig | 8 | 64.12 | 5 | 49.20 |
| Muttiah Muralitharan | 9 | 61.88 | 4 | 65.75 |
| Harbhajan Singh | 9 | 73.22 | 4 | 74.00 |
However, Lyon's home-away split has undergone a fairly significant shift over the last couple of years. Till 2014, his stats were excellent at home - 74 wickets in 19 Tests at 31.56 - but quite poor overseas, where he averaged 39.15 in 19 Tests. Since then, those numbers have reversed: his away average since the start of 2015 is an excellent 23.49, but his home average has increased to 38.48. In the 2016-17 home season, he conceded nearly 50 runs per wicket.
Going by the way he bowled at the Gabba, though, it shouldn't take long for him to rectify those home numbers too.
With inputs from Shiva Jayaraman.
S Rajesh is stats editor of ESPNcricinfo. @rajeshstats.