South Africa's slide in Asia, from 7-3 to 0-5
For an eight-year period until October 2015, South Africa were the best touring side in Asia. They have now slid to being the worst, with their stats against spin especially dire
S Rajesh
Jul 24, 2018, 12:05 PM
Associated Press
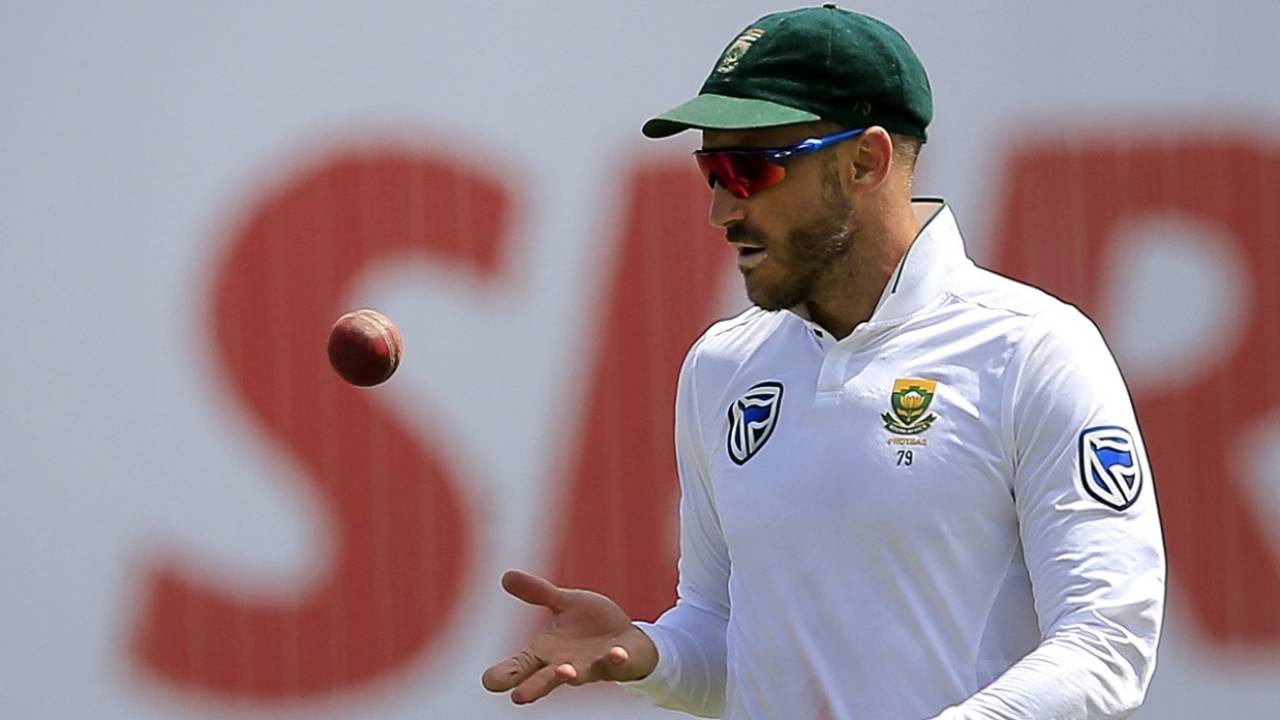
South Africa's resistance in the last innings of their Sri Lankan tour salvaged some pride, but it still left them with a 2-0 series defeat, and some uncomfortable questions regarding their batting in Asia. There used to be a time when South Africa were by far the best touring side to Asia: between October 2007 and October 2015, they had a 7-3 win-loss record in 17 Tests, and played eight series without losing any, winning three and drawing five. Since then, it has all gone a bit pear-shaped for them: on their last two tours, they have lost five out of six Tests, their only draw coming in a rain-affected game in Bangalore in 2015.
The conditions have admittedly been difficult for their batsmen in both these series, with the pitches offering plenty of assistance to spinners in India and in Sri Lanka. While South Africa's batsmen scored 26 hundreds in 17 Tests during their golden period in Asia, they managed only one in their last six.
And then there is also the toss factor. South Africa have lost the toss in each of their last six Tests in Asia. This has meant they have had the toughest of the batting conditions, and also perhaps explains why Faf du Plessis has been so vocal in his appeal to do away with the toss in Test cricket. In the 17 Tests in the 2007-15 period, they won 11 tosses, but they also won three Tests when they lost the toss: in Ahmedabad and in Dhaka in 2008, and in Dubai in 2013. They drew the other three, and averaged 40.84 in those six games when they lost the toss.
Despite the efforts of Theunis de Bruyn and Temba Bavuma in the fourth innings at the SSC, South Africa still finished the series with a batting average of 14.52, their second-lowest since readmission in series in which their batsmen have batted at least 30 times. Till that sixth-wicket partnership, they were in serious danger of ending up with a lower average than the paltry 13.75 they managed in India in 2015-16. (The next lowest, 21.98, also happened earlier this year, when India toured South Africa.)
In terms of balls per dismissal, South Africa's rate of losing a wicket every 30.9 deliveries is their worst since readmission. Even during their struggle in India in 2015-16, they still managed to survive 41.5 deliveries per dismissal.
| Series | Balls | Wkts | Balls/wkt |
| SA in SL, 2018 | 1236 | 40 | 30.90 |
| SA in Ind, 2015-16 | 2907 | 70 | 41.53 |
| Ind in SA, 2017-18 | 2757 | 60 | 45.95 |
| SA in Eng, 2017 | 3687 | 79 | 46.67 |
| Aus in SA, 2005-06 | 2974 | 60 | 49.57 |
Till this current slide, South Africa were the best batting team in Asia among the top teams from outside the subcontinent. Of late, though, they have become the worst.
The major problem in these two series is quite obvious: the inability of South Africa's batsmen to tackle spin bowling. In six Tests in these series, opposition spinners have taken 98 South African wickets at an average of 13.13; in the period between 2007 and 2015, opposition spinners had conceded almost three times as many runs - 37.50 - per South African wicket.
It is clear that the pitches have generally been tougher in these six Tests than on previous tours, but then South Africa's spinners have been unable to exploit them to the same extent. Between 2007 and 2015, South Africa's spinners averaged 38.74 runs per wicket, which is similar to what opposition spinners averaged against their batsmen. In the last couple of series, South Africa's spinners have averaged 27.57, while their batsmen have scored less than half as many runs per dismissal against opposition spinners.
In that winning period, South Africa could also rely more on their fast bowlers to deliver the wickets: they averaged 28.54 in the 2007-15 period in Asia, which was excellent given the overall averages in that period. In the last three years that average is 29.96, which, though relatively unchanged in absolute terms, hasn't been good enough given the increased potency of opposition spinners.
| Bowlers | Oct '07-'15: Wkts | Ave | Nov '15 onwards: Wkts | Ave |
| SA spinners | 78 | 38.74 | 54 | 27.57 |
| Opp spinners | 144 | 37.50 | 98 | 13.13 |
The one batsman whose fall encapsulates South Africa's decline is Hashim Amla. He played 16 out of 17 Tests in Asia between October 2007 and 2015, and scored seven hundreds in 26 innings at an average of 73.00; in 11 innings since November 2015, he has a highest score of 43, and averages 14.36. That, in a nutshell, explains South Africa's recent dire results in Asia.
| Period | Tests | Runs | Ave | 100s/50s |
| Oct '07 - Oct '15 | 16 | 1606 | 73.00 | 7/5 |
| Nov '15 onwards | 6 | 158 | 14.36 | 0/0 |
S Rajesh is stats editor of ESPNcricinfo. @rajeshstats