Player and team: runs, centuries and partnerships
Analysing various aspects of individual batting stats relative to the team performance
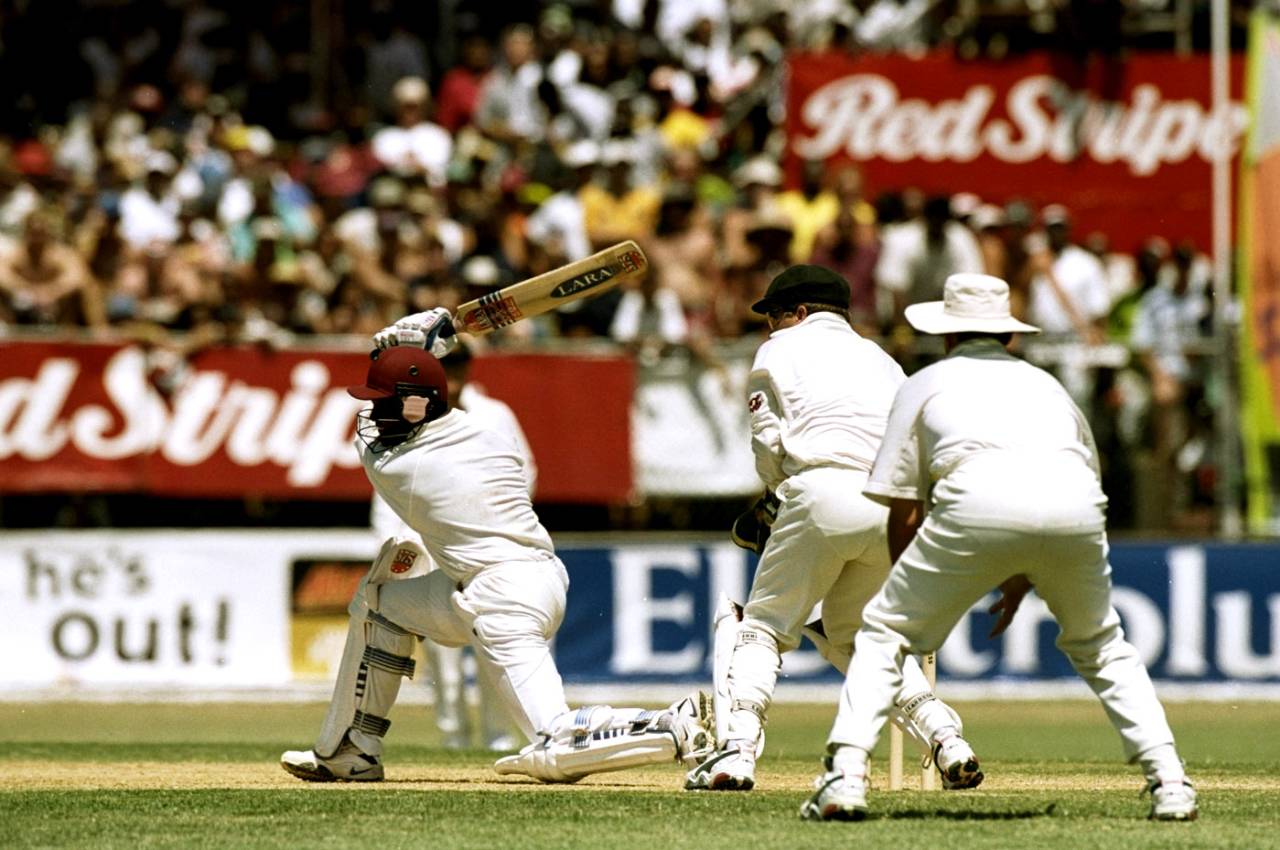
Only Bradman betters Lara's percentage contribution to team runs, centuries and 100 stands • Getty Images
In an interesting article on Bradman, Ananth dug deep into the career of the Australian batting great and came up with telling stats on his scoring patterns. Bradman's outstanding ratio of hundreds to fifties (2.23), his extraordinarily high number of double-centuries (12) and a scarcely believable average (runs-per-innings) of 150 whenever he passed 50 place him in a different league altogether. There remain very few batting fronts where Bradman is not on top. However, I thought it would be interesting to weigh his and other top run-getters' batting stats with those of their respective teams. Not only does this provide a better perspective of the batsman's contribution to the team through the course of his career, but it also helps gauge how a batsman compared to his peers. For the purpose of analysis, I have considered all batsmen (other than Bradman) with 8000-plus Test runs.
2. Percentage of team centuries scored by the player
3. Percentage of team century partnerships that the player has been involved in
4. Player's partnership runs as a percentage of total team runs
5. Player's percentage contribution in partnerships
All stats are from matches in which the player has featured.
Measuring this factor more often than not helps provide a glimpse into the team's batting strength. Both Brian Lara and Shivnarine Chanderpaul have, for much of their careers, played in a weak West Indies team, and as a result, have scored 18.87% and 16.43% of the team runs. Kumar Sangakkara and Javed Miandad are close too, and come in fourth and fifth. Bradman, however, by the sheer weight of his run-scoring ability, is on top with an astonishing 24.28% of his team runs. What makes Bradman's numbers in this case remarkable is the fact that unlike Lara and Chanderpaul, he played in fairly strong teams. To put Bradman's numbers in perspective, a comparison with George Headley would be apt. Headley, who featured in a very weak West Indies team through his short career, scored 25.15% of the team runs in the period before World War 2. Australia fielded a world-beating side packed with top-quality batsmen for much of the 1990s and 2000s. As a result, the percentage contribution of most Australian batsmen is on the lower end. Among the 25 batsmen in the list, VVS Laxman and Mark Waugh have the lowest percentage-runs contribution (11.75% and 11.79% respectively).
Is there anything different about this list? Bradman continues to stay on top with an astounding percentage of 41.42. Lara's 34 centuries constitute slightly over 33% of West Indies' hundreds in the matches he played in. Sunil Gavaskar is third, with a contribution of 29.31%. There is a significant difference between Gavaskar and the fourth-placed Kallis (24.85%). The last few spots bear a similar look to the table of percentage-runs contribution. Three Australians are present in the bottom five but Laxman again comes out last, with a percentage contribution of 12.05.
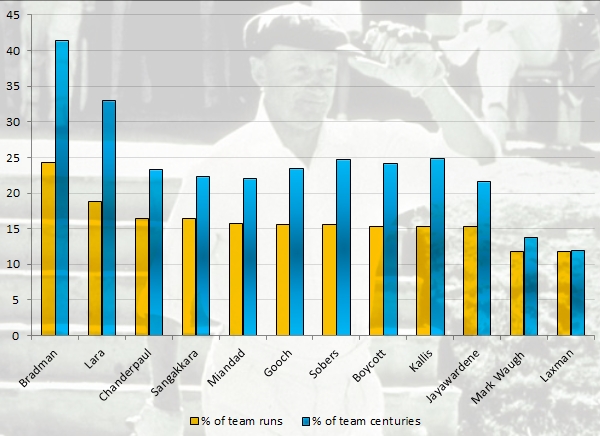 Percentage of team runs and centuries scored by player
© ESPNcricinfo ltd
The players most likely to be on top of such a list are the ones capable of occupying the crease for long intervals. Gavaskar, Miandad and Chanderpaul are in the top five but Bradman comes out on top yet again. He was involved in 53% of the total century partnerships the team managed during his career. Lara, despite his aggressive batting style, was able to post massive scores and hence figures fairly high on the list (51.23% of century stands). The top two run-getters Tendulkar and Ponting are in the middle with percentage contributions hovering around the 36 mark. Mark Waugh and VVS Laxman have been involved in some of the finest partnerships but have more often than not gifted their wickets away after a good start. As a result, they find themselves at the bottom of the list with Sehwag slightly above them at 29%.
 Percentage of century stands and team partnership runs
© ESPNcricinfo ltd
4. Player's partnership runs as a percentage of total team runs
In an article on Dravid's retirement, Rajesh illustrated the value of Dravid's batting and patience with a few interesting stats. The partnership aggregate for Dravid constituted 35.59% of the team runs in the course of his career. The number speaks volumes about his ability to stay at the crease and forge massive partnerships. Chanderpaul, who became the second West Indian batsman to cross the 10000-run mark, is also right behind Dravid with a corresponding number of 34.45%. No prizes for guessing who is on top yet again. Bradman's partnership aggregate was a remarkable 42.53% of the total runs made by Australia. The presence of Gavaskar, Boycott and Kallis in the top ten clearly indicates that this list is dominated by batsmen who put a price on their wicket.
5. Player's percentage contribution in partnerships
How dominant have players been in the partnerships they have been involved in? Is it purely their aggressive batting or is it the fact that their partners have underperformed? Sehwag leads the list scoring 58.67% of the partnership runs he was involved in. Bradman moves out of the top spot for once but is still good enough to be in second position. Still the only batsman to score 300 in a day, Bradman contributed 57.08% of the total partnership runs. The quick scorers continue to dominate the list with Viv Richards, Lara and Garry Sobers in the top five. Although he has not scored 8000 runs, to illustrate the dominance of Sehwag and Bradman, I have considered Adam Gilchrist's numbers. Gilchrist scored 5570 runs at a stunning strike rate of 81.95 through his 96-Test career but comes in fourth on the list. The fact that he played in a team full of aggressive batsmen meant that his percentage contribution was not too high. At the other end of the table are the solid, but slow-scoring Dravid, Boycott and Gavaskar.
Although he fails to make the 8000-run cut-off, Gilchrist is included in the graph purely to compare with other quick scorers
 Percentage contribution to partnerships
© ESPNcricinfo ltd
With inputs from Sajan Nair
Madhusudhan Ramakrishnan is a sub-editor (stats) at ESPNcricinfo