India's overseas hero, and much more
Rahul Dravid scored more runs in India's overseas wins than any other batsman, and his contributions go beyond his aggregate and hundreds
S Rajesh
Mar 9, 2012, 7:10 AM
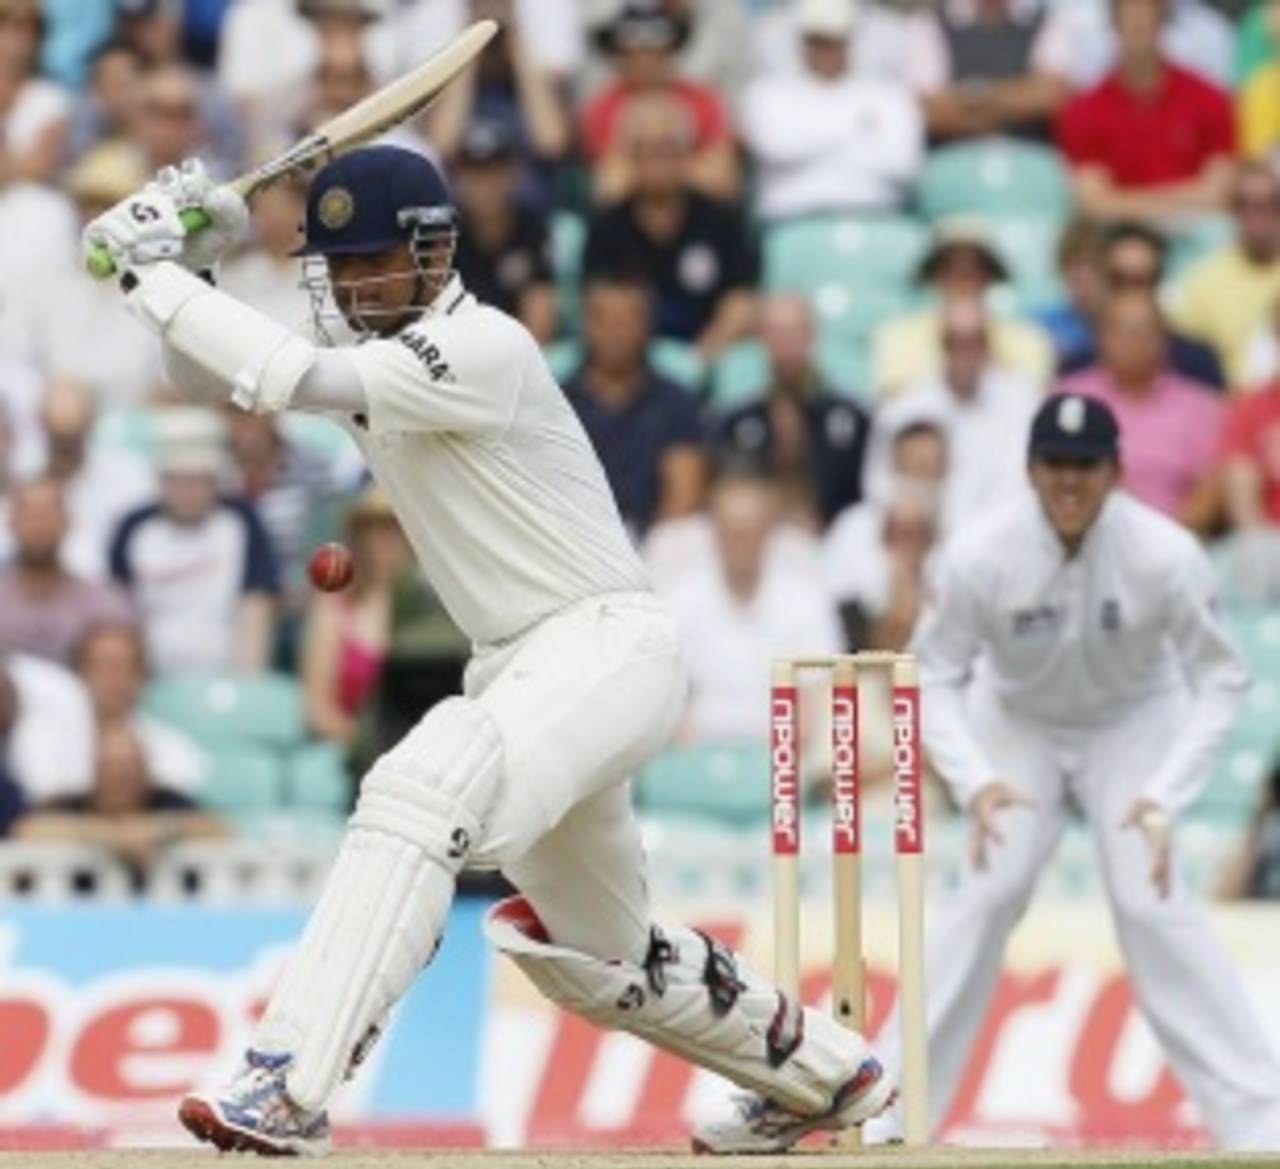
The ability to leave the ball alone was as important to Rahul Dravid's batting style as any other stroke • Associated Press
The stat that perhaps best sums up Rahul Dravid is not the runs he made or the hundreds he notched up, but the number of balls he consumed over a Test career that spanned fifteen-and-a-half years. In 286 Test innings, Dravid played 31,258 balls. Given that no other batsman has faced more than 29,000 deliveries, it puts into perspective the amount of hard work and sheer effort that went into scoring those 13,288 runs. There were other batsmen who had more natural talent, and were more elegant, aggressive, and exciting to watch. In terms of dedication to craft and working on achieving perfection, though, Dravid ranks second to none. That dedication fetched him just rewards, ensuring he scored runs in every country he played in, and finished his Test career as the second-highest run-getter, next only to Sachin Tendulkar.
From the time he scored 95 in his first Test innings against England at Lord's, it was clear he was an exceptional batting talent, but even so, not many would have envisaged a career that spanned 164 Test matches and 344 one-day internationals. His maiden Test century, a sparkling 148 against a tough South African attack in Johannesburg, further confirmed his class, and from there it has been a journey of several highs, interspersed with - as every career must have - its share of lows.
For most of his career, consistency was one of Dravid's fortes. For instance, of the first ten series that he played in (excluding one-off Tests), he averaged more than 40 in seven of them. His best phase, though, was the four-year period from the middle of 2002 to 2006, a stunning spell when he scored heavily pretty much everywhere he went: in 16 series during this period, 13 times he averaged more than 49, and nine times over 75. More importantly, he scored those runs in tough batting conditions, and in overseas Tests that led to wins abroad, a phenomenon that till then had been pretty rare in Indian cricket. During this period, his overseas average was an exceptional 77.07.
A slump followed, almost inevitably, from the middle of 2006 to 2008, when he struggled in South Africa, England, Australia and Sri Lanka. There was talk, inevitably again, that Dravid should quit Tests, but in his last three years he came out of that slump pretty well. He was among the runs in New Zealand, West Indies, and - in what must rank as arguably his best series, given the lack of batting support - in England in 2011, when he fought the England pace attack almost singlehandedly, scoring 461 runs at 76.83. His last series was admittedly a huge disappointment, but despite that he averaged more than 52 in his last 33 Tests.
| Period | Tests | Runs | Average | 100s/ 50s | Home ave | Away ave |
| Till Mar 31, 2002 | 55 | 4329 | 50.92 | 9/ 24 | 48.91 | 53.20 |
| Apr 2002 - Jul 2006 | 49 | 4720 | 68.40 | 14/ 22 | 55.71 | 77.07 |
| Aug 2006 - Dec 2008 | 27 | 1460 | 31.06 | 3/ 7 | 31.60 | 30.66 |
| Jan 2009 onwards | 33 | 2779 | 52.43 | 10/ 10 | 75.31 | 42.54 |
| Career | 164 | 13,288 | 52.31 | 36/ 63 | 51.35 | 53.03 |
At home overseas
As mentioned above, perhaps the most significant aspect of Dravid's Test career was that the runs he scored contributed significantly to India's wins, mainly overseas. Overall, Dravid scored 5131 runs in Test wins, next only to Tendulkar's 5594. However, in overseas Test wins, he was often India's main man, even more than Tendulkar. India won 15 Tests abroad during Dravid's career (excluding matches in Bangladesh and Zimbabwe), and in those games he scored 1577 runs at 65.70 - both aggregate and average is higher than Tendulkar's.
As mentioned above, perhaps the most significant aspect of Dravid's Test career was that the runs he scored contributed significantly to India's wins, mainly overseas. Overall, Dravid scored 5131 runs in Test wins, next only to Tendulkar's 5594. However, in overseas Test wins, he was often India's main man, even more than Tendulkar. India won 15 Tests abroad during Dravid's career (excluding matches in Bangladesh and Zimbabwe), and in those games he scored 1577 runs at 65.70 - both aggregate and average is higher than Tendulkar's.
Quite fittingly, Dravid was Man of the Match in the last overseas Test win that India achieved during his career - his second-innings 112 and match tally of 152 were largely instrumental in India winning a low-scoring game in Kingston by 63 runs. In all, eight of his 11 Man-of-the-Match awards came in overseas Tests, and five in overseas wins, including unforgettable performances at Headingley (2002), Adelaide (2003), Rawalpindi (2004) and Kingston (2006). Tendulkar won only five out of his 14 Man-of-the-Match awards overseas, and only one in a win (excluding Bangladesh). In fact, no Indian has won as many match awards overseas as Dravid has. (Remember, though, that this award wasn't always around during the days of some of India's earlier players.)
As well as helping India win overseas, Dravid also scored mountains of runs in draws overseas, averaging more than 75 in those matches, with ten centuries in 32 Tests. Two of those hundreds were in the drawn game in Hamilton in 1999, one of two times he scored a century in each innings of a Test. In fact, he is one of only three Indians to achieve this feat - Sunil Gavaskar and Vijay Hazare are the others.
| Batsman | Won Tests | Runs | Average | 100s/ 50s | Drawn Tests | Runs | Average | 100s/ 50s |
| Rahul Dravid | 15 | 1577 | 65.70 | 4/ 7 | 32 | 3083 | 75.19 | 10/ 17 |
| Sachin Tendulkar | 13 | 1219 | 60.95 | 5/ 3 | 42 | 3484 | 71.10 | 11/ 18 |
| VVS Laxman | 14 | 1111 | 52.90 | 2/ 8 | 26 | 1931 | 58.51 | 4/ 14 |
| Virender Sehwag | 11 | 965 | 56.76 | 3/ 1 | 15 | 1386 | 57.75 | 4/ 4 |
| Sunil Gavaskar | 9 | 756 | 50.40 | 3/ 3 | 30 | 2697 | 64.21 | 9/ 12 |
| Sourav Ganguly | 9 | 617 | 51.41 | 1/ 5 | 21 | 1601 | 59.29 | 5/ 8 |
| Gundappa Viswanath | 6 | 533 | 53.30 | 2/ 3 | 19 | 1040 | 40.00 | 2/ 8 |
No. 1 at No. 3
India didn't always have the luxury of solid opening pairs through his career, which made Dravid's presence at No. 3 all the more important. He is the only batsman at the moment to have scored more than 10,000 runs at that position, and he did it at a superb average too, scoring close to 53 runs per dismissal. At No. 3, though, his home record was better - he averaged 54.81 in India, and 51.35 abroad. In overseas Tests excluding Bangladesh and Zimbabwe, his average at No. 3 fell marginally below 50, to 48.75.
India didn't always have the luxury of solid opening pairs through his career, which made Dravid's presence at No. 3 all the more important. He is the only batsman at the moment to have scored more than 10,000 runs at that position, and he did it at a superb average too, scoring close to 53 runs per dismissal. At No. 3, though, his home record was better - he averaged 54.81 in India, and 51.35 abroad. In overseas Tests excluding Bangladesh and Zimbabwe, his average at No. 3 fell marginally below 50, to 48.75.
| Batsman | Innings | Runs | Average | 100s/ 50s |
| Rahul Dravid | 219 | 10,524 | 52.88 | 28/ 50 |
| Ricky Ponting | 196 | 9904 | 56.27 | 32/ 43 |
| Kumar Sangakkara | 158 | 8702 | 58.79 | 27/ 36 |
| Don Bradman | 56 | 5078 | 103.63 | 20/ 10 |
| Richie Richardson | 107 | 4711 | 47.11 | 14/ 21 |
| Rohan Kanhai | 90 | 4689 | 52.68 | 13/ 20 |
| David Boon | 111 | 4412 | 45.58 | 13/ 20 |
| Ian Chappell | 91 | 4279 | 50.94 | 13/ 22 |
Dravid's stats at No. 3 sorted by the score at which he came in to bat present some interesting numbers. He averaged only 38 when the first wicket fell with ten runs or fewer on the board, but on the 18 occasions when the first wicket fell at zero, he averaged 51.94, with three centuries and as many fifties. In fact, his highest Test score, 270, came when he came out to bat second ball, after Virender Sehwag had fallen to Shoaib Akhtar off the first ball of the innings in Rawalpindi. He also had plenty of success when he came in to bat fairly early, with the score between 11 and 20. The 148 at Headingley in 2002 came after the first wicket fell for 15, while the 217 that followed in the next Test, at The Oval, was scored after the first wicket fell at 18.
He obviously relished coming in to bat after the openers had given the team a solid start. On the 66 occasions when they added more than 50, Dravid averaged 62.41. Among his key knocks in such situations was the 233 in Adelaide in 2003 - that match-winning effort came after the openers had added 66.
| Point of entry | Innings | Runs | Average | 100s/ 50s |
| 10 or below | 66 | 2322 | 38.07 | 4/ 12 |
| 11 to 20 | 45 | 2482 | 60.54 | 7/ 9 |
| 21 to 50 | 42 | 1913 | 53.14 | 4/ 11 |
| 51 and above | 66 | 3807 | 62.41 | 13/ 18 |
Staying through partnerships
Dravid's ability to spend long periods at the crease meant bowlers had to invariably work hard to get his wicket. On an average, he played 123 balls per dismissal, which works out to 20.3 overs. Since the year of his debut, the only batsman who has faced 10,000-plus deliveries and has a higher rate of balls per dismissal is Jacques Kallis, who averages 125.55 balls per dismissal. They're the only two batsmen with a balls-per-dismissal figure of more than 120. Further down the table below, Tendulkar and Kumar Sangakkara have similar numbers: both have higher averages than Dravid, but their higher scoring rates also mean they don't play as many deliveries per dismissal.
Dravid's ability to spend long periods at the crease meant bowlers had to invariably work hard to get his wicket. On an average, he played 123 balls per dismissal, which works out to 20.3 overs. Since the year of his debut, the only batsman who has faced 10,000-plus deliveries and has a higher rate of balls per dismissal is Jacques Kallis, who averages 125.55 balls per dismissal. They're the only two batsmen with a balls-per-dismissal figure of more than 120. Further down the table below, Tendulkar and Kumar Sangakkara have similar numbers: both have higher averages than Dravid, but their higher scoring rates also mean they don't play as many deliveries per dismissal.
| Batsman | Innings | Not outs | Balls faced | Average | Strike rate | Balls per dismissal |
| Jacques Kallis | 253 | 39 | 26,867 | 57.28 | 45.62 | 125.55 |
| Rahul Dravid | 286 | 32 | 31,258 | 52.31 | 42.51 | 123.06 |
| Shivnarine Chanderpaul | 221 | 33 | 21,365 | 48.79 | 42.93 | 113.64 |
| Thilan Samaraweera |
114 | 20 | 10,497 | 53.42 | 47.84 | 111.67 |
| Steve Waugh | 137 | 21 | 12,705 | 53.06 | 48.45 | 109.53 |
| Gary Kirsten | 143 | 14 | 13,841 | 47.19 | 43.98 | 107.29 |
| Sachin Tendulkar | 256 | 25 | 23,781 | 56.22 | 54.61 | 102.95 |
| Kumar Sangakkara | 179 | 12 | 17,191 | 55.97 | 54.37 | 102.94 |
Dravid's ability to spend long periods at the crease obviously meant his contribution to the team was much more than just the runs he scored. His solidity at the top of the order allowed the other, more extravagant, strokeplayers in the Indian team to express themselves freely, knowing that Dravid would hold his end up for long periods without losing concentration.
The table below shows that when Dravid was at the crease, the team scored 32,039 runs (60 of those runs were in the Test between Australia and the ICC World XI, so 31,979 runs were scored by the Indian team). Given that the entire Indian team scored 89,668 runs, it means 35.6% of the total runs that India made in Tests involving Dravid were scored with him at the crease. The corresponding percentage for Tendulkar is 29.9, and 32.6 for Kallis. Dravid is also the only batsman to be involved in more than 700 partnerships; in fact, no other batsman has even touched 650 so far.
Every time Dravid walked out to bat, he was involved in, on an average, 2.58 partnerships. Among batsmen who've played at least 100 innings, only Shivnarine Chanderpaul has a higher partnerships-per-innings number (2.66). So, while Dravid scored heaps of runs himself, his batting style also meant many more runs were being scored from the other end while he was around, all of which helped the team's cause.
| Batsman | Partnerships | P'ship runs | 100/ 50 stands | Batsman runs | Percentage |
| Rahul Dravid | 738 | 32,039 | 88/ 126 | 13,288 | 41.47 |
| Sachin Tendulkar | 646 | 30,278 | 85/ 121 | 15,470 | 51.09 |
| Ricky Ponting | 496 | 26,703 | 85/ 110 | 13,200 | 49.43 |
| Jacques Kallis | 578 | 26,107 | 64/ 119 | 12,260 | 46.96 |
| Allan Border | 617 | 24,500 | 63/ 104 | 11,174 | 45.61 |
| S Waugh | 590 | 23,457 | 64/ 87 | 10,927 | 46.58 |
| Brian Lara | 508 | 21,495 | 62/ 84 | 11,953 | 55.61 |
| Sunil Gavaskar | 519 | 21,080 | 58/ 85 | 10,122 | 48.02 |
| Mahela Jayawardene | 420 | 20,635 | 63/ 78 | 10,086 | 48.88 |
Dravid has also been involved in more century stands than any other batsman: he finishes at 88, with two other current players about whom there has been plenty of retirement talk - Tendulkar and Ponting - on 85 each. Dravid is also the only batsman to have ten or more century stands with four others. And with Tendulkar, Dravid scored more partnership runs and century stands than any other pair, including openers: 6920 runs in 143 partnerships at 50.51, with 20 century stands.
| Batsman | Century stands | Partners with 10+ century stands |
| Rahul Dravid | 88 | Tendulkar (20), Laxman (12), Sehwag (10), Ganguly(10) |
| Ricky Ponting | 85 | Hayden (16), Langer (14) |
| Sachin Tendulkar | 85 | Dravid (20), Ganguly (12) |
| Jacques Kallis | 64 | de Villiers (12) |
| Steve Waugh | 64 | - |
| Allan Border | 63 | - |
| Mahela Jayawardene | 63 | Sangakkara (14), Samaraweera (10) |
| Brian Lara | 62 | Sarwan (12) |
| Shivnarine Chanderpaul | 60 | - |
| Sunil Gavaskar | 58 | Chauhan (11), Vengsarkar (10), M Amarnath (10) |
Beyond the batsman
And if all those achievements as a batsman are not enough, Dravid was captain of the Indian Test team for 25 Tests, a period during which the team had an 8-6 win-loss record, and won series in West Indies and England. Among Indian captains who led in 20 or more Tests, only MS Dhoni and Sourav Ganguly have a better win-loss ratio.
And if all those achievements as a batsman are not enough, Dravid was captain of the Indian Test team for 25 Tests, a period during which the team had an 8-6 win-loss record, and won series in West Indies and England. Among Indian captains who led in 20 or more Tests, only MS Dhoni and Sourav Ganguly have a better win-loss ratio.
| Captain | Tests | Win/Loss | Draw | W/L ratio |
| MS Dhoni | 37 | 17/ 10 | 10 | 1.70 |
| Sourav Ganguly | 49 | 21/ 13 | 15 | 1.61 |
| Rahul Dravid | 25 | 8/ 6 | 11 | 1.33 |
| Sunil Gavaskar | 47 | 9/ 8 | 30 | 1.12 |
| Mohammad Azharuddin | 47 | 14/ 14 | 19 | 1.00 |
And on the field, he snaffled a record 210 catches, mostly in the slips. That was another aspect of the game where his immense powers of concentration stood him in good stead.
There's plenty to like about Rahul Dravid's Test career. The one aspect that's disappointing, though, is his record against Australia and South Africa, arguably the two best bowling sides during his playing period. His poor final series in Australia meant his overall average against them dipped below 40 (38.67), while against South Africa he averaged only 33.83. Thus, in 54 Tests against those two teams, he averaged 36.75 with only four hundreds; in 27 Tests in those two countries, he averaged 36.53, with only two centuries. He never scored another Test hundred in South Africa after that 148 in Johannesburg in 1996-97, while the 233 in Adelaide remained his only Test hundred in Australia. Those, though, are minor blips in a career that largely stayed at an exceptionally high level through more than 15 years.
With inputs from Travis Basevi
S Rajesh is stats editor of ESPNcricinfo. Follow him on Twitter