The Maxwell phenomenon
Glenn Maxwell has been outstanding in the T20 format, combining perfectly the art of low dot-ball and high boundary percentage
S Rajesh
25-Apr-2014
Since October last year, Glenn Maxwell has scored 697 Twenty20 runs in 20 innings at a strike rate of 200 • BCCI
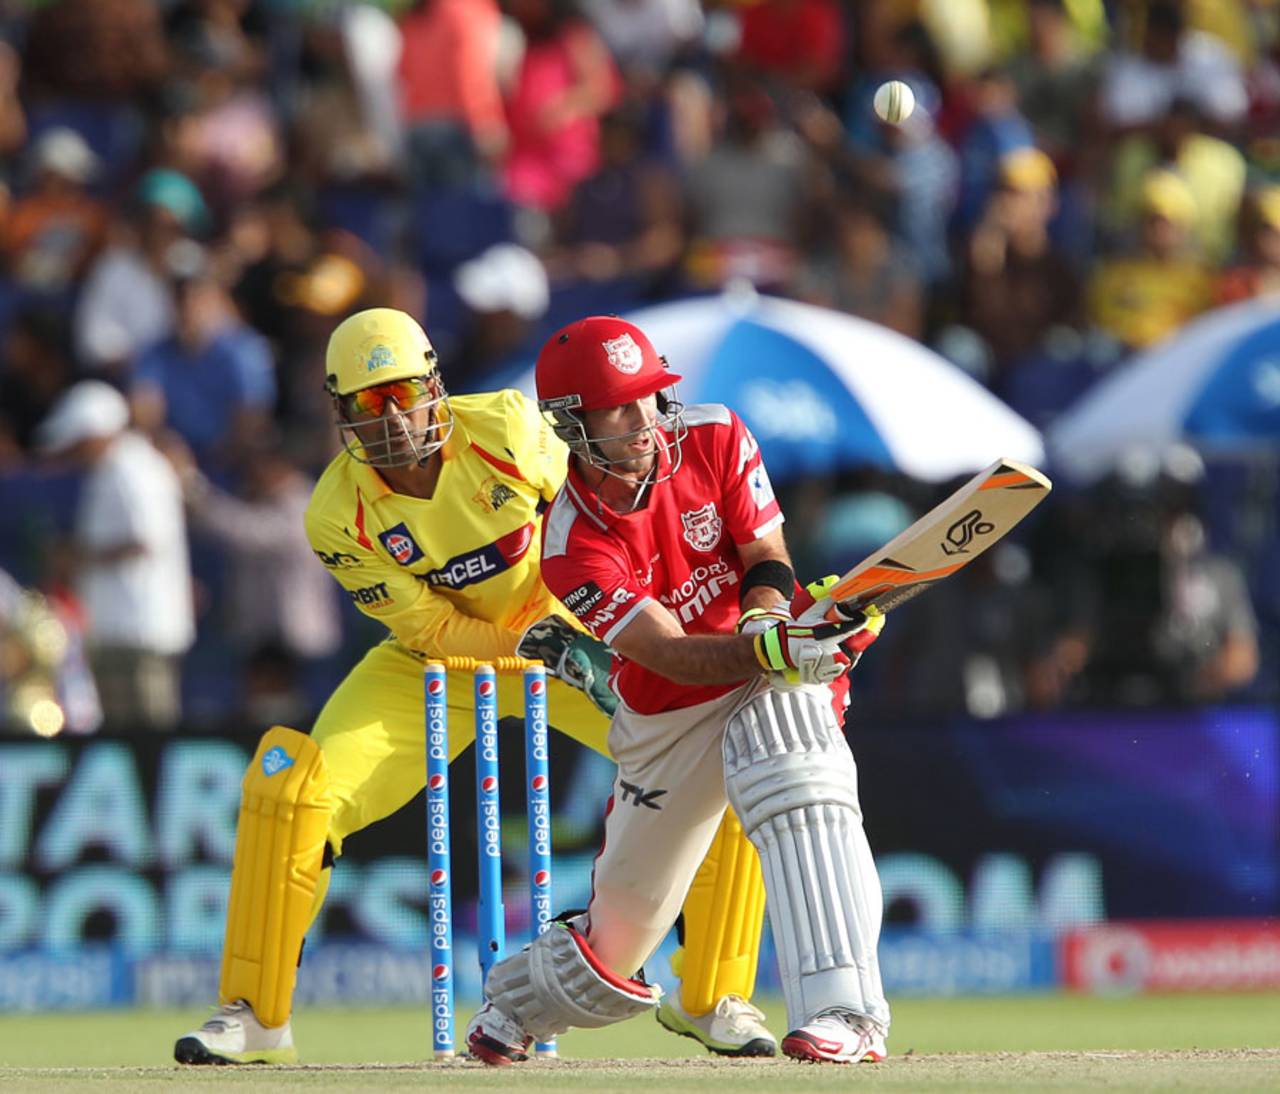
In the first ten matches of IPL 2014, there's little doubt that the one player who has created the biggest buzz has been Glenn Maxwell. In three innings he has amassed 279 runs off 131 balls, twice scoring 95 off 43 balls in the space of five days - as if it was the most normal thing to do - and once hitting 89 off 45 in between. His frenetic hitting has brought him almost twice as many runs as any other batsman in the first week - the next-highest after ten games is Dwayne Smith with 145. It's also ensured that Kings XI Punjab - the franchise he is playing for this season - have struck 30 sixes in three matches, with 17 of them coming off Maxwell's bat; the only other team with more sixes than Maxwell is Chennai Super Kings, with 18.
He has had some luck but he has ridden it well, leaving the bowlers wondering how to take his wicket, and leaving Mumbai Indians wondering why they let him go after having him for a season in 2013 - Maxwell only played three IPL games for them last year. In the current season, Mumbai are languishing on all fronts, including the sixes count - they are at the bottom with a grand total of two from two games.
Maxwell's three scores this season are, incidentally, his three highest scores in T20 matches: coming into this year's IPL, Maxwell had played 62 innings in T20 cricket, and his highest had been 82, for Melbourne Stars against Sydney Sixers in a Big Bash game in 2012. In his five previous innings in the IPL - two for Delhi Daredevils in 2012 and three last year for Mumbai - he had scored 42 runs at an average of 14 and a strike rate of 110.52. Those are unrecognisable from the kind of stats he has notched up so far this year.
In fact, since the start of the 2013-14 season, Maxwell has taken his T20 game up a notch. In his last 20 innings, he has scored five fifties, averaged 38.72, and scored at a strike rate of 200.86. Before this IPL blitz, he had two other high-impact innings during this period: in the Big Bash against Melbourne Renegades, he scored a 28-ball 58 with six sixes, while in the World T20 against Pakistan a month ago, he blasted 74 off 33, though Australia still contrived to lose that one. In his first 45 T20 innings, by contrast, he scored 777 runs - just 80 more than he has scored in his last 20 - at an average of 20 and a strike rate of 140.
In his T20 career so far, Maxwell has already played in the leagues in Australia, England and India, apart from playing 21 matches for Australia. He's clearly a star in this format, but his first-class record - four centuries and 11 fifties in 46 innings - suggests he'll be looking to add to his current tally of two Test matches.
| Innings | Runs | Average | Strike rate | 50s | |
| T20Is | 17 | 303 | 20.20 | 165.57 | 1 |
| Big Bash | 20 | 427 | 23.72 | 155.83 | 2 |
| IPL + CLT20 | 13 | 423 | 38.45 | 183.91 | 3 |
| Twenty20 Cup (England) | 15 | 321 | 26.75 | 148.61 | 2 |
| Career | 65 | 1474 | 26.32 | 163.23 | 8 |
| Period | Innings | Runs | Average | Strike rate | 50s |
| Till Sep 2013 | 45 | 777 | 20.44 | 139.74 | 3 |
| Since Oct 2013 | 20 | 697 | 38.72 | 200.86 | 5 |
| Innings | Runs | Average | Strike rate | 100s/ 50s | |
| First-class | 46 | 1765 | 41.04 | 74.72 | 4/ 11 |
| List A | 44 | 1235 | 36.32 | 129.18 | 1/ 10 |
| ODIs | 23 | 621 | 34.50 | 124.20 | 0/ 6 |
One of the key tenets of T20 batting is to keep dot balls at a minimum, and that's something Maxwell has always managed superbly, and even more so over the last seven months. Overall in his T20 career, Maxwell's dot-ball percentage is about 35, and in the last seven months it's dropped even further, to 30. That means he is able to score off most deliveries he faces, which eases the pressure on the non-striker as well.
Along with a low dot-ball percentage, Maxwell's also scored a high percentage of his runs in boundaries - about 69% in his T20 career, and almost 77% in the last seven months. A combination of low dot-ball percentage and high boundary percentage is ideal in Twenty20 cricket, and that's something Maxwell has excelled in throughout his career, and even more so recently.
| Runs | Dismissals | Average | Strike rate | Dot % | Boundary % | |
| Pace | 819 | 31 | 26.41 | 160.5 | 37.06 | 70.33 |
| Spin | 655 | 24 | 27.29 | 167.5 | 32.74 | 66.87 |
| Total | 1474 | 56* | 26.32 | 163.2 | 35.18 | 68.79 |
| Runs | Dismissals | Average | Strike rate | Dot % | Boundary % | |
| Pace | 383 | 9 | 42.55 | 205.8 | 31.18 | 78.85 |
| Spin | 314 | 8 | 39.25 | 195.0 | 28.57 | 73.89 |
| Total | 697 | 18* | 38.72 | 200.86 | 29.97 | 76.61 |
In the last seven months, no batsman has scored as many T20 runs as Maxwell, and none of the others in the top eight have a strike rate anywhere close to his: while Maxwell touches 200, the next-best among the top eight run-scorers is his Kings XI mate David Miller, who strikes at 150.
Most of the batsmen in the table below are specialists in the limited-overs format, but at No. 4 sits Hashim Amla, who hasn't done badly in the five-day format either. Maxwell's currently not one of the front runners for a place in the Australian Test team, but his recent first-class form has been outstanding as well: his four innings in 2014 read as follows - 94, 127, 119 and 4. His 127 came in the second innings for Victoria against New South Wales, in a team total of 186 after Victoria had been reduced to 9 for 6. Given his first-class record - especially his recent exploits - he could well get an opportunity to build on the two Tests he played in India last year. Till then, he can continue to make waves in the 20-over format.
| Batsman | Innings | Runs | Average | Strike rate | 100/ 50s |
| Glenn Maxwell | 20 | 697 | 38.72 | 200.86 | 0/ 5 |
| Quinton de Kock | 20 | 672 | 37.33 | 128.24 | 0/ 3 |
| Aaron Finch | 18 | 666 | 39.17 | 143.22 | 0/ 7 |
| Hashim Amla | 19 | 648 | 36.00 | 133.88 | 0/ 4 |
| Anamul Haque | 19 | 646 | 35.88 | 134.58 | 1/ 2 |
| David Miller | 24 | 629 | 41.93 | 150.47 | 0/ 6 |
| JP Duminy | 20 | 621 | 56.45 | 131.84 | 0/ 5 |
| Kusal Perera | 14 | 509 | 39.15 | 145.01 | 0/ 6 |
S Rajesh is stats editor of ESPNcricinfo. Follow him on Twitter