Pitch Quality Index revisited
An objective, numbers-based analysis of pitches in Test matches, which indicates that the ICC's warning for the recent Nagpur wicket was justified
Anantha Narayanan
09-Jan-2016
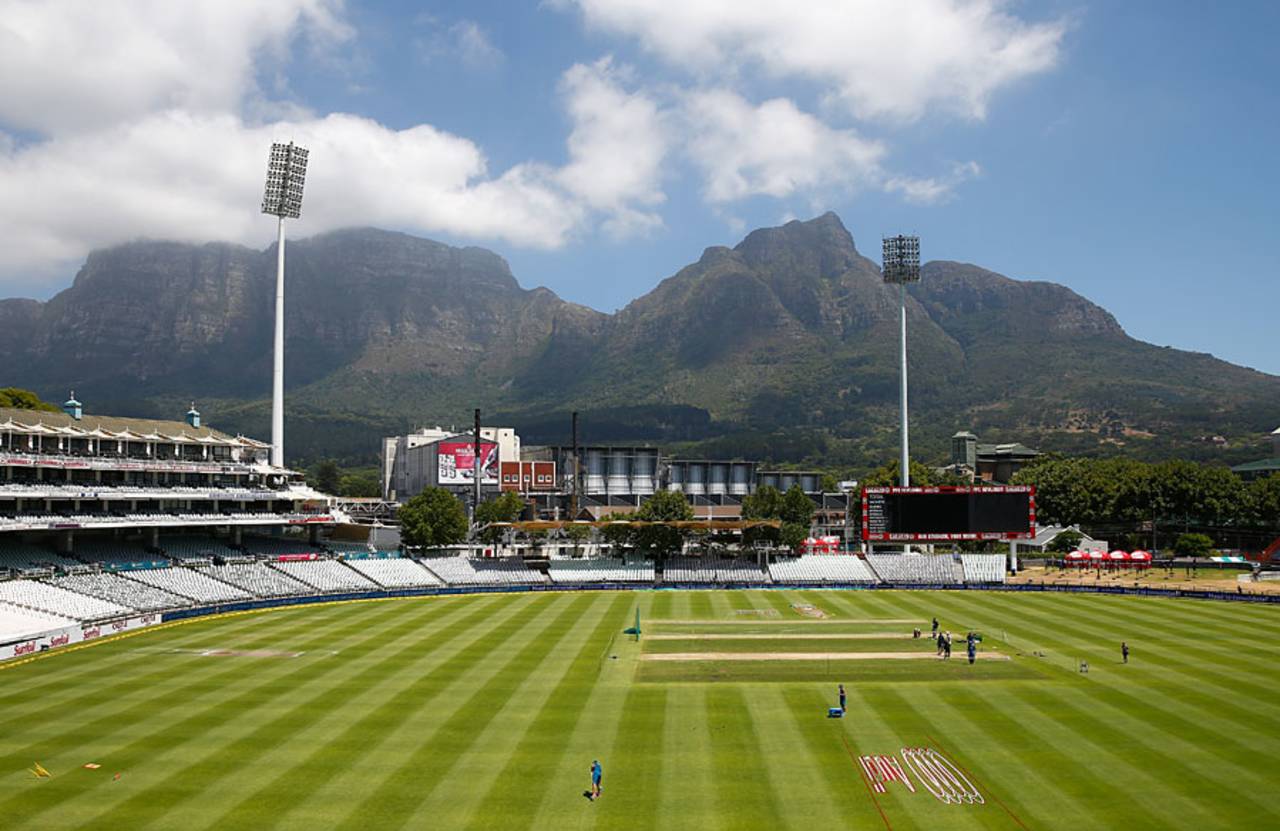
A high PQI of 80.5 in the recent Newlands Test meant that it was one of the most batsman-friendly pitches of all time • Getty Images
After six months of sabbatical, the homing pigeon is back. To say that I am looking forward to resuming writing on ESPNcricinfo and continuing my treasured interactions with the site's readers is indeed an understatement. My sincere thanks to Sambit Bal and S Rajesh for giving me the opportunity to do some serious work on my book, recharge my batteries and allowing me to pick up where I left six months back.
I have been able to complete about two-thirds of my first book. In order to continue working on the book and take care of publishing and other related activities, I will be doing only one article a month from January onwards. I will try and make these articles meaningful. If required, combining two topics. I also take this opportunity to wish all the readers a wonderful 2016. May God be with all of you and your families.
During the period I was away, Virender Sehwag retired. It would be a major lapse on my part not to do a special unique tribute to that wonderful cricketer. I have also done a lot of tweaking of the Pitch Quality Index (PQI) as part of work relating to my book. I tried combining these two fascinating topics into one article. However, the combined article became too long and, regretfully, I have to keep the Sehwag tribute to a later date.
I did some significant work on the PQI a couple of years back. There were some important comments. Most of these have been incorporated and important tweaks done. The PQI is now a well-constructed measure without any weaknesses. It is time the current version of the PQI is revealed, especially in view of the recent controversy on pitches. I can assure readers that at the end of this article they will have lots of new insights relating to the prickly issue.
The PQI is a scorecard-based determination of pitch quality. History has no part to play. I have already demonstrated the futility of historic data quite a few times and one more time would not be amiss.
The scores in Hamilton in the Test between New Zealand and India in December 2002 were Ind: 99, Nzl: 94, Ind: 154 and Nzl: 160/6. Match RpW being 14.08. Fifteen months later, in March 2004, in the Test between New Zealand and South Africa, the scores were Saf: 459, Nzl: 509, Saf: 313/4 and Nzl: 39/1. Match RpW was 52.8. Yes, in Hamilton indeed. In the interim, the New Zealand-Pakistan Test produced an RpW of 40.1. Recently Hamilton has gone back to RpW values in the 20s. Anyone who tries to use these historic nuggets of data to get a handle on the Hamilton pitch would be a candidate for the loony bin.
Only three Tests have been played in Nagpur during the past five years. The RpW figures have been 33.4, 43.8 and recently, 16.3. So where do we place Nagpur? The moral is to ignore history, lest it turns and bites us.
The formula for PQI is given below. Readers should try and make sense of these calculations. It will help them in getting a handle on an important measure. PQI is determined in two stages. First PSum is calculated and then PSum is mapped on to PQI.
PSum = P1 + P2 + P3.
P1 = Match RpW / 30.0. (Maximum limited to 3.0).
P2 = Actual score / Expected Runs for Batsmen who batted. (Maximum limited to 3.0).
P3 = Expected wickets for balls bowled / Actual wickets captured. (Maximum limited to 3.0).
P2 = Actual score / Expected Runs for Batsmen who batted. (Maximum limited to 3.0).
P3 = Expected wickets for balls bowled / Actual wickets captured. (Maximum limited to 3.0).
Note:
1. The average batsman Runs per Wicket (RpW) for the 2196 Tests until end of 2015 is 30.2. This figure has been rounded off to 30.
2. The batting averages and bowling strike rates used are for applicable locations: home or away. After all R Ashwin is expected to pick up more wickets at home than away while bowling the same number of overs. And Brendon McCullum's home average is much better than his away average.
3. There is no problem with batsmen who are dismissed or those who score in excess of their averages. A tweak is needed only for the batsmen who remain unbeaten at scores below their averages.
4. No problems in bowling calculations since the exact number of balls bowled by each bowler is used while computing the expected number of wickets.
All three parameters have equal weight. So the total ranges from 0.0 to 9.0. Initially I was using the PSum as the PQI. However, there was a serious drawback with that approach, which I have now corrected. The median value for the sum is 3.0 and not 4.5. If we take an imaginary perfect match with an RpW of 30.0 and one in which the expected runs are equal to actual runs and expected wickets are equal to actual wickets, the sum of indices is 3.0. So the numbers were not linearly spaced.
Hence I have adopted a mapping methodology. The PQI is fixed between 0 and 50 for the values of PSum between 0.0 and 3.0, and between 50 and 100 for the values of PSum between 3.0 and 9.0. This ensures that the final PQI value is between 0.0 and 100.0 and is in proper understandable linear scale. This is proved by the fact that 1118 Tests have values below 50.0 and 1078 Tests have PQI values of 50.0 and above. These mapped figures will be my final PQI indices and are used in many important calculations, including performance ratings.
It will be obvious from the working given above that a low PQI value indicates a bowler-friendly pitch and a high PQI indicates a batting-friendly pitch. I would place a PQI of 1.0 as the by-now-dried Chennai lane after the recent floods and 99.0 as a sheet-front highway, impeccably maintained; 50 would represent a fair, middling pitch which offers assistance to both bowlers and batsmen.
In reality, the PQI value ranges from 13.6 for Test #216 (36, 153 and 45: 234 for 30 wkts) to 92.2 for Test #418 (450/2, 531/7 and 112/1: 1093 for 10 wkts). A perfect match in this measure will have a PQI of 50.0. There are 9 such matches and there is a table listing these Tests.
The logic behind using these parameters is simple. RpW is the single comprehensive measure to indicate the type of pitch. It is a general value which pinpoints a pitch quite clearly.
However, that is not enough. Good batsmen are capable of scoring more runs than other batsmen. So their scores have to be properly evaluated. A batting line-up led by Sachin Tendulkar is expected to score more than a Mohammad Ashraful-led line up. A 250 would be totally below-par for the 1948 Australia team; it would be a wonderful score for the 1953 New Zealand team.
Similarly, good bowlers are capable of capturing more wickets than poor bowlers. A bowling attack spearheaded by Dale Steyn should surely do much better than one led by Tendai Chatara. The South African bowlers would probably be expected to capture 10 wickets in 80 overs. The Zimbabwe attack would capture about five wickets. This "expected" information has to be compared with what happened on the field to get more insight on the nature of pitch.
Let me give the example of recent Test match - Test# 2192 between New Zealand and Sri Lanka. The scores - Nzl: 431, Slk: 294, Nzl: 267/3 and Slk: 282. The expected runs for the four innings were 362, 272, 199 and 272 respectively. The required adjustment has been done for Brendon McCullum remaining not out on 13 in the third innings. The expected wickets for the overs bowled were 8.2, 11.3, 6.1 and 9.2 respectively. The match RpW was 38.6.
PSum = (38.6/30.0) + (1274/1105) + (34.8/33).
PSum works out to 3.493 which maps on to a PQI value of 56.2, indicating a pitch disposed towards batting. A visual inspection of the scores confirms this.
Let me also provide a pitch group table based on PQI values.
PQI of 10 - 25: Most diabolical of all pitches. Should be suspended warned.
PQI of 25 - 35: Very strongly bowler-friendly pitches. Should be looked into.
PQI of 35 - 50: Bowler-friendly, but not unplayable. Should be fine.
PQI of 50 - 65: Batsman-friendly, but a lot for the bowlers also. Very good.
PQI of 65 - 80: Very strongly batsman-friendly pitches. Normally leads to draws.
PQI of 80 - 90: Zero assistance to the bowlers. Should be warned.
I will provide three tables in this article. The first one lists the 10 Test matches with very low PQI values. These indicate pitches that were totally bowler-friendly. I have taken a conscious decision to exclude the 134 Tests played before 1915. The second one lists the 10 Tests with very high PQI values. These indicate pitches that were batting paradises. The third is a list of Tests that had the perfect PQI of 50.0. Finally I will comment on the Mumbai, Mohali, Nagpur, Adelaide and Hamilton pitches.
| Test | Year | PQI | Location | First Inns | Second Inns | Third Inns | Fourth Inns | Match RpW | Won By |
| 216 | 1932 | 13.6 | Aus | Saf: 36/10 | Aus: 153/10 | Saf: 45/10 | 7.8 | AUS | |
| 238 | 1935 | 17.0 | Win | Win: 102/10 | Eng: 81/ 7 | Win: 51/ 6 | Eng: 75/ 6 | 10.7 | ENG |
| 1633 | 2002 | 20.9 | Nzl | Ind: 99/10 | Nzl: 94/10 | Ind: 154/10 | Nzl: 160/ 6 | 14.1 | NZL |
| 327 | 1950 | 21.9 | Aus | Aus: 228/10 | Eng: 68/ 7 | Aus: 32/ 7 | Eng: 122/10 | 13.2 | AUS |
| 1720 | 2004 | 22.7 | Ind | Ind: 104/10 | Aus: 203/10 | Ind: 205/10 | Aus: 93/10 | 15.1 | IND |
| 275 | 1946 | 22.8 | Nzl | Nzl: 42/10 | Aus: 199/ 8 | Nzl: 54/10 | 10.5 | AUS | |
| 1617 | 2002 | 23.3 | UAE | Pak: 59/10 | Aus: 310/10 | Pak: 53/10 | 14.1 | AUS | |
| 471 | 1959 | 23.6 | Bng | Pak: 145/10 | Win: 76/10 | Pak: 144/10 | Win: 172/10 | 13.4 | PAK |
| 1296 | 1995 | 24.9 | Win | Aus: 128/10 | Win: 136/10 | Aus: 105/10 | Win: 98/ 1 | 15.1 | WIN |
| 346 | 1952 | 25.2 | Ind | Ind: 121/10 | Eng: 203/10 | Ind: 157/10 | Eng: 76/ 2 | 17.4 | ENG |
Ah! One end of the horror spectrum. Scoring a fifty in these matches was a monumental achievement. The first match in this list was not even from the pre-WWI era. It was indeed a nightmare match. Imagine a team scoring the "huge" total of 153 and winning with a couple of innings to spare. Don Bradman did not bat because of an ankle injury. Eleven of the South African batsmen did not cross 1. The playing time was 353 minutes: less than a day's play. The PQI is 13.6: something to wonder about.
Then we move forward three years. Ten ducks were scored in this match. On the last day, play only started at 3.30 pm, with West Indies struggling at 33 for 3. Grant declared at tea, a real surprise, setting England only 75 to win. England promptly slid to 48 for 6. But Hammond steered them home. The freak declaration led to a PQI of 17.0.
Now we travel over 70 years to India's nightmare tour of New Zealand in 2002-03. It suffices to say that India got a five-run lead on a sub-100 first-innings score. A tough four-wicket win in a match in which just over 500 runs were scored led to a PQI of 20.9. It is interesting to note that not a single fifty was scored in these three Tests in which 109 innings were played.
And we move on: Mumbai 2004. Australia had already won the series and this was the so-called "dead rubber". But it was not dead for the home team. The pitch - it may be an exaggeration to call the 22x4 strip as a pitch; "a lane near Crawford Market" might be a better description. This was a huge lottery of a match. India won the toss and were dismissed for a total around the 100-mark. However, even after conceding a lead of nearly 100 runs, India were very much in the match. Australia were set 107 to win and fell a few runs short. The PQI was a miserable 22.7. But nobody bothered. Maybe someone should have.
A couple of years earlier, Australia had visited Sharjah to play Pakistan there. Pakistan were the home team and were expected to win comfortably, especially as they had Waqar Younis, Shoaib Akhtar and Saqlain Mushtaq in their ranks. What happened was carnage. Australia's competent 310 was sandwiched between two Pakistan dismissals: for 59 in 32 overs on the first day and 53 in 25 overs on the second day. No one can explain what happened in the desert. The only undisputed fact is that the loss of 20 wickets for 112 runs far outweighed the 310 runs for 10 wickets, and the match landed with a PQI value of 23.3. For once, I would not blame the pitch. Was Shane Warne as unplayable as his match figures of 17.5-6-24-8 indicate? Let us just say: two awful days in the office for Pakistan.
| Test | Year | PQI | Location | First Inns | Second Inns | Third Inns | Fourth Inns | Match RpW | Won By |
| 418 | 1955 | 92.2 | Ind | Nzl: 450/ 2 | Ind: 531/ 7 | Nzl: 112/ 1 | 109.3 | Draw | |
| 1374 | 1997 | 88.5 | Slk | Ind: 537/ 8 | Slk: 952/ 6 | 106.4 | Draw | ||
| 1781 | 2006 | 88.4 | Pak | Pak: 679/ 7 | Ind: 410/ 1 | 136.1 | Draw | ||
| 1259 | 1994 | 86.7 | Win | Win: 593/ 5 | Eng: 593/10 | Win: 43/ 0 | 81.9 | Draw | |
| 1911 | 2009 | 86.6 | Win | Eng: 600/ 6 | Win: 749/ 9 | Eng: 279/ 2 | 95.8 | Draw | |
| 696 | 1972 | 86.5 | Win | Win: 365/ 7 | Nzl: 543/ 3 | Win: 86/ 0 | 99.4 | Draw | |
| 1750 | 2005 | 86.0 | Win | Saf: 588/ 6 | Win: 747/10 | Saf: 127/ 1 | 86.0 | Draw | |
| 1026 | 1985 | 85.4 | Pak | Slk: 479/10 | Pak: 555/ 3 | 79.5 | Draw | ||
| 1909 | 2009 | 84.5 | Pak | Slk: 644/ 7 | Pak: 765/ 6 | Slk: 144/ 5 | 86.3 | Draw | |
| 1966 | 2010 | 84.1 | Slk | Slk: 642/ 4 | Ind: 707/10 | Slk: 129/ 3 | 86.9 | Draw |
These matches belong to the other end of the spectrum. If scoring a fifty was an achievement in the first list of matches, capturing a wicket was so in these.
I am not going to dwell much on these matches. The scores speak for themselves. The first match was the Delhi run-fest between India and New Zealand during 1955. Not a minute was lost due to rain, but 10 wickets fell in five days. The match RpW was over 100. Not just that, the teams scored at an excruciatingly slow rate of 2.30. A single bowling analysis will delineate the Test: that of Vijay Manjrekar, a pure batsman, 20.0-13-16-1. The PQI also is very revealing: a jaw-dropping 92.2.
The only other match I am going to talk about is the run-a-thon in Colombo in 1997: 952/6 met 537/8. Five spinners conceded 276, 223, 195, 174 and 122 respectively and captured five wickets. Nilesh Kulkarni took a wicket with his first ball in Test cricket and then bowled 489 balls (and 138 more in the next innings) without success. The PQI: a very descriptive 88.5.
The other matches follow in similar vein. All 10 matches were, understandably, drawn. The first lot of 10 at least produced results.
| Test | Year | PQI | Location | First Inns | Second Inns | Third Inns | Fourth Inns | Match RpW | Won By |
| 386 | 1954 | 50.0 | Win | Win: 139/10 | Eng: 414/10 | Win: 346/10 | Eng: 72/ 1 | 31.3 | ENG |
| 957 | 1983 | 50.0 | Eng | Eng: 209/10 | Nzl: 196/10 | Eng: 446/ 6 | Nzl: 270/10 | 31.1 | ENG |
| 1070 | 1987 | 50.0 | Nzl | Win: 418/ 9 | Nzl: 157/10 | Nzl: 273/10 | Win: 16/ 0 | 29.8 | WIN |
| 1355 | 1997 | 50.0 | Nzl | Nzl: 346/10 | Eng: 228/10 | Nzl: 186/10 | Eng: 307/ 6 | 29.6 | ENG |
| 1477 | 1999 | 50.0 | Nzl | Win: 365/10 | Nzl: 393/10 | Win: 97/10 | Nzl: 70/ 1 | 29.8 | NZL |
| 1729 | 2004 | 50.0 | Aus | Pak: 341/10 | Aus: 379/10 | Pak: 163/10 | Aus: 127/ 1 | 32.6 | AUS |
| 1784 | 2006 | 50.0 | Bng | Bng: 319/10 | Slk: 338/10 | Bng: 181/10 | Slk: 163/ 2 | 31.3 | SLK |
| 2135 | 2014 | 50.0 | Zim | Zim: 256/10 | Saf: 397/10 | Zim: 181/10 | Saf: 44/ 1 | 28.3 | SAF |
| 2146 | 2014 | 50.0 | UAE | Nzl: 403/10 | Pak: 393/10 | Nzl: 250/ 9 | Pak: 196/ 5 | 36.5 | Draw |
As a lark, I have presented the almost perfect Tests as far as PQI is concerned. These are Tests with PQI values of exactly 50.0 and are self-explanatory. The only comment I would make is that not a single match in this collection has the exact RpW of 30.0. Those variations are offset by the batsmen and bowler comparisons values.
Incidentally the almost symmetric Ashes Test, which ended in a three-run win for England, has a PQI of 44.6 (Eng: 284/10 Aus: 287/10 Eng: 294/10 and Aus: 288/10. RpW of 28.8). Australian batsmen were quite good and their expected runs are above 300.
A note on the PQI summaries over the years. During the pre-WWI period, 134 Tests were played with a low average PQI of 45.1. During the WW1-WW2 period, 140 Tests were played with a much better average PQI of 49.7. During the period 1946-1989, 859 Tests were played at the very acceptable average of 49.9. During the past 25 years, 1061 Tests have been played at the nice middle-level average of 50.5. So once we decide to ignore the first 134 Tests, we are on a very balanced set of 2000 plus Test matches, on the whole.
During the past 25 years, the overall situation is quite acceptable. The 113 Tests in South Africa have been played at a slightly below-par average of 48.1. Sri Lanka is the other country with a below-par average of 49.1. The 52 Tests in Bangladesh have a slightly above-par average of 51.94. The other seven countries fall in between. We are now beginning to see the benefits of the linear scale of 0 to 100. I am certain that 50.0 is the middle value.
Finally, my concluding observations on various matches and the Nagpur/Mohali pitches.
Mumbai 2004 was a diabolical pitch. The PQI was an extremely low 22.7. I am surprised that there was no ICC warning for this pitch. Perhaps it was due to the circumstances and the fact that Australia had already won the series. However, Australia had no business losing that Test.
Mohali 2015 was a very difficult pitch but not unplayable. The PQI of 29.3 confirms that. The pitch was just about fair but could have been better. South Africa could have won if they had applied themselves better, as they did later in Delhi.
Nagpur 2015 was something else. The PQI of 26.3 indicates that it was a very difficult pitch, maybe not as bad as the Mumbai pitch was. The ICC's warning seems justified. The Delhi pitch, on the other hand, has a reasonably healthy PQI of 42.6. After all it took India 143 overs to prise out 10 wickets.
Adelaide 2015 was nowhere as bad a pitch as Nagpur: the PQI was 33.2. It should not be forgotten that this was the first day-night Test and a lot of grass was left on since no one had any idea how the pink ball would hold up. Less grass could easily have pushed this Test to a PQI in the mid-40s. Hamilton 2015 was a similar pitch with a PQI of 36.0. Delhi was perfectly all right. The batsmen had a chance and the bowlers had to toil hard, not just turn their arms over.
Just for interest, the PQI for the Newlands Test, where 600 met 600 head-on, is a huge 80.5. It is in the top-20 most batsman-friendly Tests of all time.
Finally a few observations.
1. I can live with a scoreline of Saf: 150, Ind: 400 and Saf: 150. This indicates a fair pitch and the lack of application of one team. Somewhat similar to Trent Bridge 2015: Australia: 60, Eng: 391/9, Aus: 253.
2. While evaluating the quality of pitches in a subjective manner, do not look at the scores of the visiting teams but at the scores of the home teams. Differentiate between Hamilton/Mumbai/Nagpur and Trent Bridge/Lord's/Hobart (all 2015)
3. Swinging pitches are not created. These are the result of atmospheric conditions, ball maintenance and reverse swing. If England had produced an absolute greentop and Australia was dismissed for 60, how did England score nearly 400 runs? Or during 2011, when India could only score 221 and 158, how could England score 288 and 544?
4. If South Africa had won the tosses at Mohali and Nagpur, they might have won one of the Tests. Win the toss, score 200 and win the match does not seem to be good for the game.
5. My personal view, and this will surely be endorsed by many true followers of the game, is that any pitch on which scoring 250 is impossible, has to be termed as a really poor pitch.
6. There is no doubt that India deserved to win the series. They bowled better, batted better, and for that matter fielded better. They did not need these gluepots (at least in two locations) to win the series. The great Indian spinners of the '70s and '80s would have considered it an insult to their skills to bowl on these types of pitches.
7. Sentiments have been expressed that the low PQI matches are fine since those lead to results. It is eminently true and I am fine with that. I would still want such pitches to be looked into critically.
8. Finally a message to the Indian team and the BCCI. You are good enough to win against all opposition on spinner-friendly pitches, which you have the right to prepare at home. You do not need poor-quality pitches to achieve this. Over the last 11 years, there have been three really awful pitches in India, the only country to have had as many. These are not needed. And this is not a "subjective" statement made without facts, but an "objective" one based on irrefutable and verifiable numbers.
9. It is also sad that many commentators and ex-players offer their, often superficial, sound bites, not always backed by data bytes.
Once again wishing all the readers a wonderful 2016. I hope my second innings is more like Sunil Gavaskar's than Sehwag's. More on the latter half of Sehwag's career in a later article.
Anantha Narayanan has written for ESPNcricinfo and CastrolCricket and worked with a number of companies on their cricket performance ratings-related systems