England's biggest spin hope
Graeme Swann has had an outstanding 15 months in Test cricket; the challenge is to ensure he maintains those levels of success
S Rajesh
19-Mar-2010
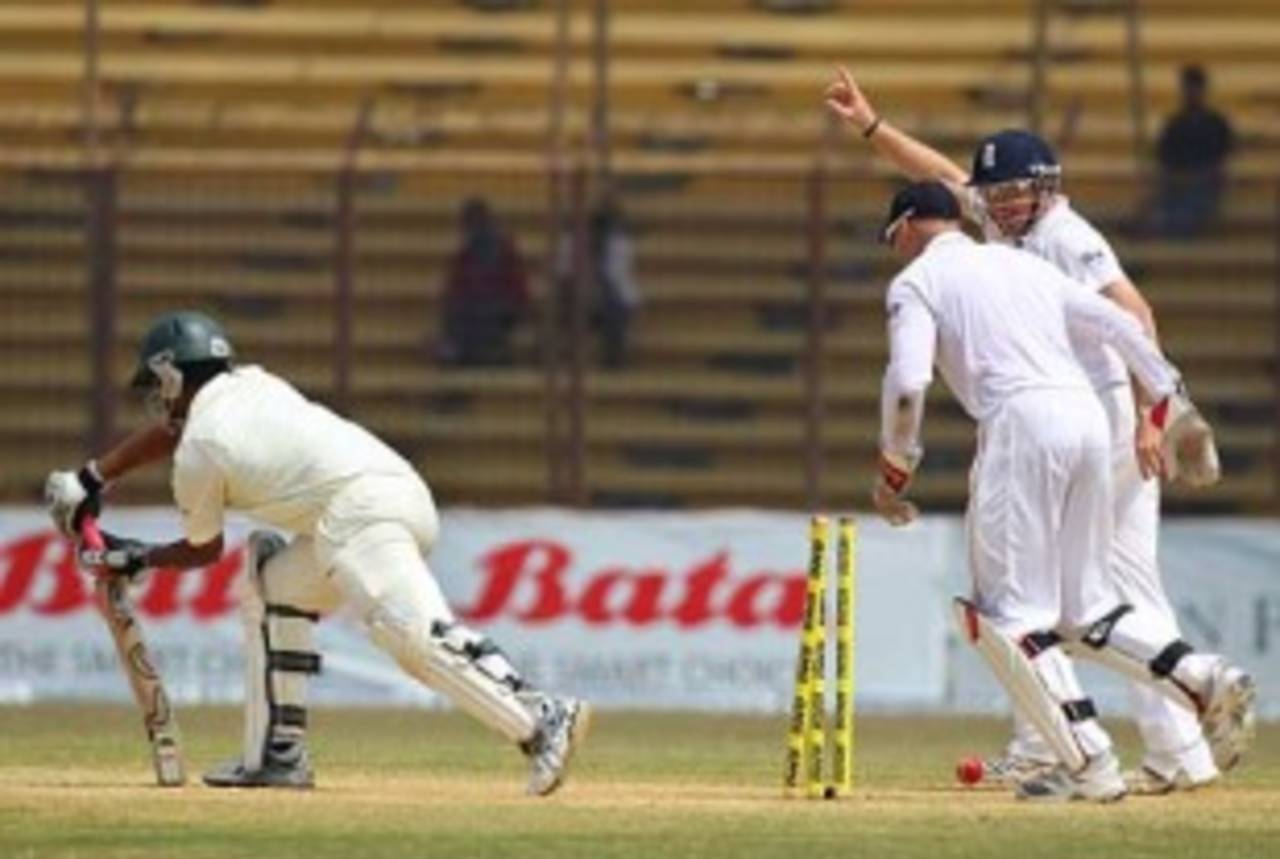
Left-handers have found Graeme Swann particularly tough to handle, and here another one, Bangladesh's Tamim Iqbal, is left clueless • Getty Images
With his ten-wicket haul in the Chittagong Test against Bangladesh, Graeme Swann propelled himself into second place in the ICC rankings for Test bowlers, but more importantly, over the last 15 months he has given the England attack a completely different look and feel. There used to be a time when a spinning track used to put England at a severe disadvantage against most opposition line-ups, due to the relative inabilities of their batsmen and bowlers to handle those conditions, but now at least one half of that puzzle seems to have been solved.
Of course, Swann will need to consistently replicate this form over the next year and more - remember, the second year is said to be the most difficult for an international cricketer - but his current numbers compare very favourably with some of the leading bowlers over the last few years. His average of 29.55 has been bettered by only three spinners in the last five years (among those who've taken at least 50 wickets during this period). Swann's average during this period is better than that of Daniel Vettori, Anil Kumble and Harbhajan Singh, who has found a real competitor to the title of best-offspinner-after-Muttiah Muralitharan.
| Bowler | Tests | Wickets | Average | Strike rate | 5WI/ 10WM |
| Muttiah Muralitharan | 41 | 260 | 22.40 | 48.2 | 22/ 9 |
| Shane Warne | 26 | 147 | 25.07 | 50.0 | 9/ 2 |
| Stuart MacGill | 12 | 56 | 28.51 | 49.8 | 3/ 0 |
| Graeme Swann | 17 | 79 | 29.55 | 59.1 | 6/ 1 |
| Shakib Al Hasan | 18 | 63 | 31.38 | 65.9 | 6/ 0 |
| Daniel Vettori | 39 | 130 | 31.50 | 72.7 | 7/ 1 |
| Anil Kumble | 40 | 175 | 34.19 | 67.6 | 7/ 2 |
| Monty Panesar | 39 | 126 | 34.37 | 71.7 | 8/ 1 |
| Harbhajan Singh | 40 | 166 | 34.39 | 70.6 | 9/ 2 |
| Paul Harris | 29 | 87 | 35.12 | 75.9 | 3/ 0 |
| Danish Kaneria | 36 | 160 | 36.89 | 70.4 | 8/ 0 |
And comparing Swann with all bowlers since the time he made his debut, only four have a better average, and all of them bowl fast. Swann leads the way for the spinners, with Nathan Hauritz (average 30.75) and Harbhajan Singh (31.97) coming in next.
| Bowler | Tests | Wickets | Average | Strike rate | 5WI/ 10WM |
| Mohammad Asif | 6 | 32 | 23.31 | 49.0 | 2/ 0 |
| Dale Steyn | 11 | 60 | 25.41 | 44.6 | 4/ 2 |
| Zaheer Khan | 12 | 53 | 27.24 | 48.6 | 3/ 1 |
| Mitchell Johnson | 17 | 82 | 27.75 | 49.9 | 3/ 1 |
| Graeme Swann | 17 | 79 | 29.55 | 59.1 | 6/ 1 |
Swann's entry is also huge for England because over the last three decades they've struggled to find spinners who've been consistently incisive. Among England spinners who've taken at least 50 wickets during this period, Swann's average and strike rate are easily the best. In fact, his strike rate of 59.1 deliveries per wicket is more than 12 balls better than the second-placed Monty Panesar.
Several of the other bowlers in the list had a few superb performances, but couldn't sustain them over an entire career. Nick Cook, the left-arm spinner, took 32 wickets in his first four Tests at an average of 17, and then managed just 20 in his last 11 at an average of 57. Similarly, Phil Tufnell had his moments, including two ten-wicket hauls, but finished with an average of less than three wickets per Test. The other Phil in the list, Edmonds, played 33 Tests during this period and averaged close to 40, while Ashley Giles and John Emburey were good to hold an end up, but could hardly be expected to take a clutch of wickets and run through batting line-ups.
| Bowler | Tests | Wickets | Average | Strike rate | 5WI/ 10WM |
| Graeme Swann | 17 | 79 | 29.55 | 59.1 | 6/ 1 |
| Nick Cook | 15 | 52 | 32.48 | 80.2 | 4/ 1 |
| Monty Panesar | 39 | 126 | 34.37 | 71.7 | 8/ 1 |
| Phil Tufnell | 42 | 121 | 37.68 | 93.2 | 5/ 2 |
| Phil Edmonds | 33 | 76 | 39.76 | 104.5 | 0/ 0 |
| Ashley Giles | 54 | 143 | 40.60 | 85.1 | 5/ 0 |
| John Emburey | 59 | 129 | 41.08 | 108.9 | 6/ 0 |
Thanks to Swann, the percentage of wickets taken by spinners for England has gone up significantly in the last 15 months - spin has accounted for more than 33% of their wickets in Tests during this period. It's nowhere near as high as the number for Bangladesh, Sri Lanka or even India, but it's much higher than what it used to be for England in the days before Swann arrived on the scene. In the period from the beginning of 2000 to November 2008, only 314 out of the 1728 wickets that England nabbed fell to spin, a percentage of 18.17.
England's percentage in the last 15 months is also much higher than the corresponding numbers for South Africa and Australia. Swann's ten-wicket haul in slow conditions in Chittagong obviously helped, but he also grabbed 21 wickets in four Tests in South Africa, where spin wasn't expected to be much of a factor.
| Team | Tests | Total wkts | Wkts by spinners | Percentage |
| Bangladesh | 8 | 117 | 78 | 66.67 |
| Sri Lanka | 12 | 168 | 96 | 57.14 |
| India | 12 | 186 | 89 | 47.85 |
| Pakistan | 11 | 157 | 58 | 36.94 |
| New Zealand | 11 | 176 | 64 | 36.36 |
| England | 19 | 271 | 91 | 33.58 |
| West Indies | 14 | 170 | 49 | 28.82 |
| South Africa | 12 | 199 | 51 | 25.63 |
| Australia | 17 | 289 | 60 | 20.76 |
Four out of Swann's 10 victims in Chittagong were left-handers, with Bangladesh's captain Shakib Al Hasan falling to him both times. Shakib isn't alone in struggling against Swann, though - in South Africa, Ashwell Prince and JP Duminy had a torrid time against him in the Tests, with Prince being dismissed by him three times in five balls, without scoring a single run.
Overall, Swann has been far more effective against left-hand batsmen than against right, which probably explains the work he's been putting into developing his version of the doosra. Against left-handers he averages less than 22 runs per wicket, and strikes every 50 deliveries; against the righties the average goes up to almost 40.
| Wickets | Average | Strike rate | Econ rate | |
| Right-handers | 34 | 39.97 | 71.26 | 3.36 |
| Left-handers | 45 | 21.68 | 50.02 | 2.60 |
In fact, Swann's average against left-handers is the best among all bowlers who've dismissed such batsmen at least 30 times in the last five years. Swann's 45 wickets have come at 21.68, which is marginally better than Mohammad Asif's average of 23.10.
| Bowler | Wickets | Average | Strike rate | Run rate |
| Graeme Swann | 45 | 21.68 | 50.02 | 2.60 |
| Mohammad Asif | 30 | 23.10 | 44.60 | 3.10 |
| Morne Morkel | 35 | 24.65 | 52.00 | 2.84 |
| Muttiah Muralitharan | 80 | 25.17 | 56.90 | 2.65 |
| Lasith Malinga | 30 | 25.73 | 48.00 | 3.21 |
| Shane Warne | 47 | 26.63 | 47.23 | 3.38 |
| Matthew Hoggard | 48 | 27.31 | 48.21 | 3.39 |
| Zaheer Khan | 60 | 28.40 | 53.88 | 3.16 |
Swann's start has been superb, but he needs to ensure he doesn't go the way of some of the other England spinners who started well and then fell away. A look at some of their spinners in the last 50 years indicates quite a few had very good numbers after 17 Tests, which is how many Swann has played so far. Edmonds averaged less than 24 and Emburey under 30, but the overall averages for both ended up around 10 runs higher. Monty Panesar had superb stats too after 17 Tests - 65 wickets at 28.40 - but he has only managed 61 wickets in his last 22 Tests. Swann's challenge will be to ensure his second year in international cricket is as good as his first.
| Bowler | Wickets | Average | Strike rate | 5WI/ 10WM |
| Derek Underwood | 71 | 17.63 | 60.6 | 6/ 2 |
| Phil Edmonds | 48 | 23.89 | 79.6 | 2/ 0 |
| John Emburey | 43 | 29.11 | 89.4 | 1/ 0 |
| Monty Panesar | 65 | 28.40 | 58.5 | 6/ 1 |
| Ashley Giles | 47 | 38.57 | 92.8 | 2/ 0 |
| Phil Tufnell | 54 | 39.20 | 88.9 | 4/ 1 |
S Rajesh is stats editor of Cricinfo