All numbers point to Australia
Fittingly, the Champions Trophy final will be contested between the two teams which historically have the best win-loss record in this tournament
S Rajesh
Oct 4, 2009, 1:49 PM
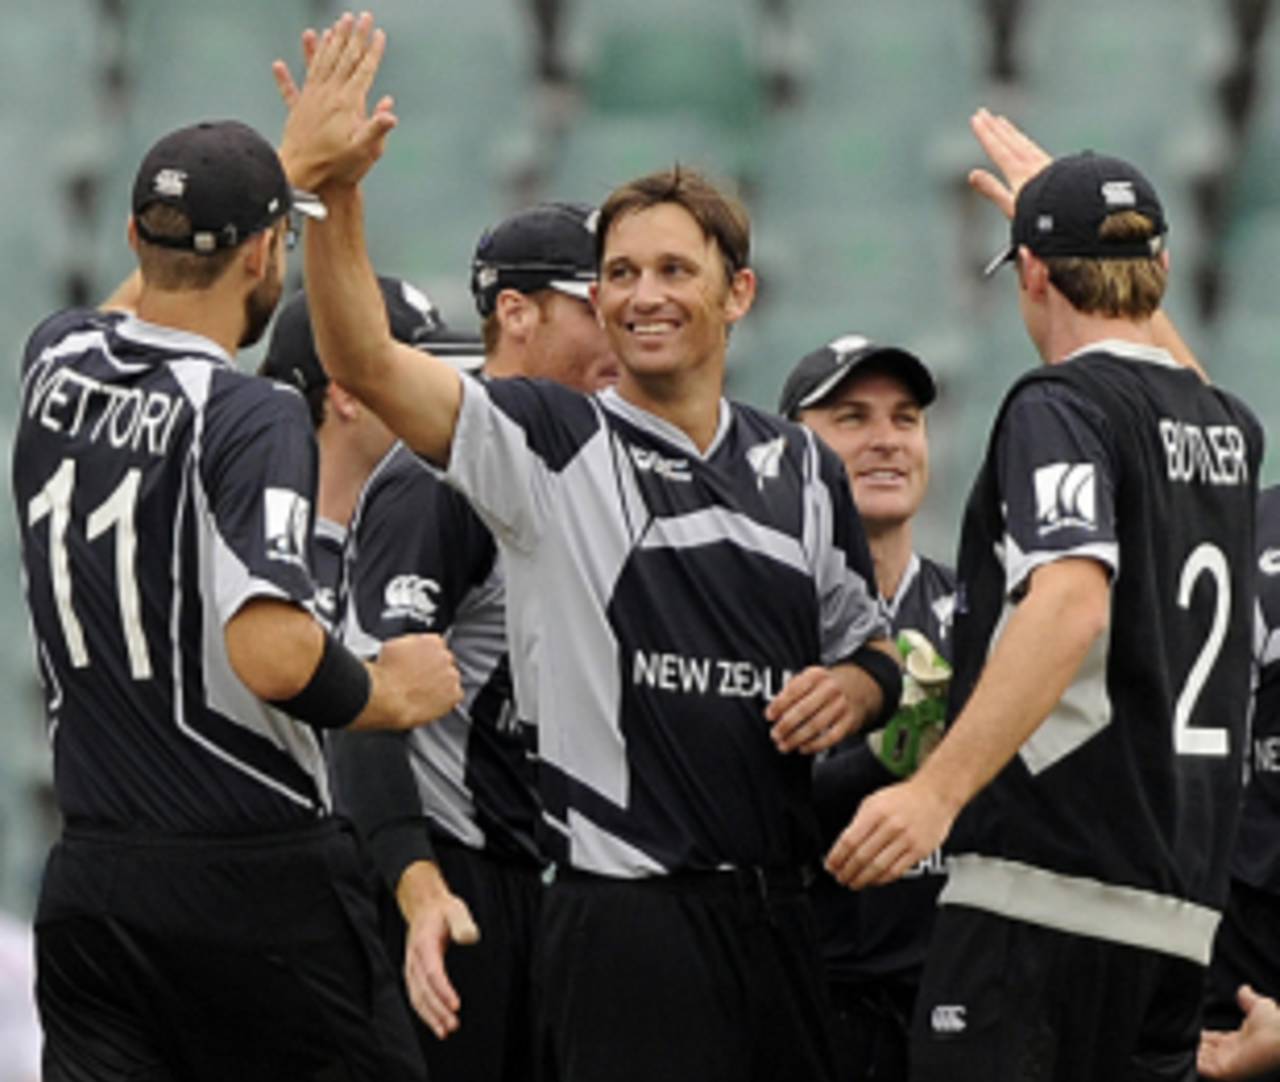
Shane Bond has taken 34 wickets in 11 ODIs against Australia, and he needs to be in top form on Monday • AFP
Fittingly, the Champions Trophy final will be contested between two teams which historically have the best win-loss record in this tournament. Australia have won 11 and lost five (win-loss ratio 2.20) in the six editions of this tournament, while New Zealand have won as many and lost six (ratio 1.83).
Australia go in as overwhelming favourites, with a dominant record against New Zealand in all ODIs, in recent games, and in multi-team tournaments. New Zealand have only competed well against the Australians in the Chappell-Hadlee Series - the teams are tied at seven matches each in 16 games. Over the last three years, Australia won ten and lost only five ODIs against New Zealand, while the dominance is even more overwhelming in multi-team tournaments (tournaments involving five or more teams) - New Zealand have won only two out of 12 such matches, in the 1992 and 1999 World Cups. The two teams have played three times in the Champions Trophy - in the last three editions - and Australia have won each time, by 164 runs, seven wickets, and 34 runs. And the only time they played in South Africa - in the 2003 World Cup - Australia cruised home by 96 runs despite Shane Bond's outstanding spell of 6 for 23.
Moreover, Australia have a superb record in the finals of big tournaments. Since losing to Sri Lanka in the 1996 World Cup final, they've won four in a row - three World Cups, and the Champions Trophy in 2006. New Zealand have won the only big final they've played - the 2000 Champions Trophy clash against India.
| Type/ period | ODIs played | Aus won | NZ won | Tie/ NR |
| All ODIs | 117 | 80 | 32 | 0/ 5 |
| Last three years | 17 | 10 | 5 | 0/ 2 |
| Neutral venues | 16 | 15 | 1 | 0/ 0 |
| 5+ team tournaments | 12 | 10 | 2 | 0/ 0 |
| Champions Trophy | 3 | 3 | 0 | 0/ 0 |
| in South Africa | 1 | 1 | 0 | 0/ 0 |
Australia's top order has been in superb form in this tournament, and most of them have enjoyed playing New Zealand. Ricky Ponting, the tournament's highest run-scorer with 287 at an average of almost 96, will fancy his chances of another big score on Monday - he averages 49.83 against New Zealand, though he has scored only 37 in his four most recent innings against them. Michael Hussey has done even better, with an average of 69.08 at a strike rate of 95.06 in 21 innings. Brett Lee has been quite outstanding with the ball against New Zealand: he is one short of 50 ODI wickets against them, averaging 20.75 from 26 matches, with seven instances of three or more wickets in an innings. Mitchell Johnson hasn't been as successful, though, averaging 39.07 for his 14 wickets.
New Zealand will expect Shane Bond to lift his game against Australia: in 11 previous innings, Bond has taken an incredible 34 wickets against them at a superb average of 13.88. He has taken three or more wickets in an innings six times, including three five-fors. Vettori has had considerably less success, taking only 42 wickets in 47 innings, though his economy rate is an impressive 4.22.
Ross Taylor has had plenty of success against Australia, averaging 40.28 in 15 innings, but Brendon McCullum's record is more patchy - an average of 29 in 33 innings, with only four fifties.
Australia and New Zealand in the 2009 Champions Trophy
Australia have been the better batting team in this tournament, with an average of 46.33, the highest by far among all teams. New Zealand, though, have taken the highest number of wickets - 34.
| Team | Runs | Bat ave | Run rate | Wkts | Bowl ave | Econ rate |
| Australia | 973 | 46.33 | 5.27 | 25 | 27.48 | 4.75 |
| New Zealand | 910 | 32.50 | 5.26 | 34 | 25.67 | 4.82 |
Both teams have utilised the Powerplays pretty well as batting teams - neither side has lost too many wickets upfront, while the batting Powerplay has yielded a run-rate of more than nine an over.
| Team | Type of Powerplay | Runs per wkt | Runs per over |
| Australia | Mandatory | 54.75 | 5.48 |
| Fielding | 84.00 | 4.20 | |
| Batting | 81.00 | 9.63 | |
| New Zealand | Mandatory | 74.00 | 5.55 |
| Fielding | 80.00 | 5.33 | |
| Batting | 26.00 | 9.10 |
New Zealand have been the better bowling team in the Powerplay, especially in terms of taking wickets. In the mandatory Powerplay they've taken seven wickets at an average of just over 26, and they've added three more wickets in the fielding Powerplays. In the batting Powerplays, though, they've managed only one wicket.
Australia have been more effective in the batting Powerplays, taking seven wickets and conceding less than six runs per over. They've taken only four wickets in the mandatory Powerplays, though they've also had one less innings to bowl in (the match against India was washed out).
| Team | Type of Powerplay | Runs per wkt | Runs per over |
| Australia | Mandatory | 43.50 | 5.80 |
| Fielding | 59.00 | 3.93 | |
| Batting | 18.25 | 5.76 | |
| New Zealand | Mandatory | 26.14 | 4.58 |
| Fielding | 28.00 | 4.20 | |
| Batting | 125 | 7.28 |
The first three day-night games in Centurion were all won by the team batting first (Sri Lanka v South Africa, Pakistan v India and England v South Africa), but Australia redressed that balance by convincingly chasing down 258 in their semi-final against England. If the pitch for the final is as good as that one, the toss shouldn't be much of a factor on Monday.
S Rajesh is stats editor of Cricinfo