8-0 to South Africa in the last ten Newlands Tests
Stats preview to the series decider in Cape Town, a venue at which South Africa haven't been beaten in their last ten Tests
S Rajesh
Feb 28, 2014, 4:10 PM
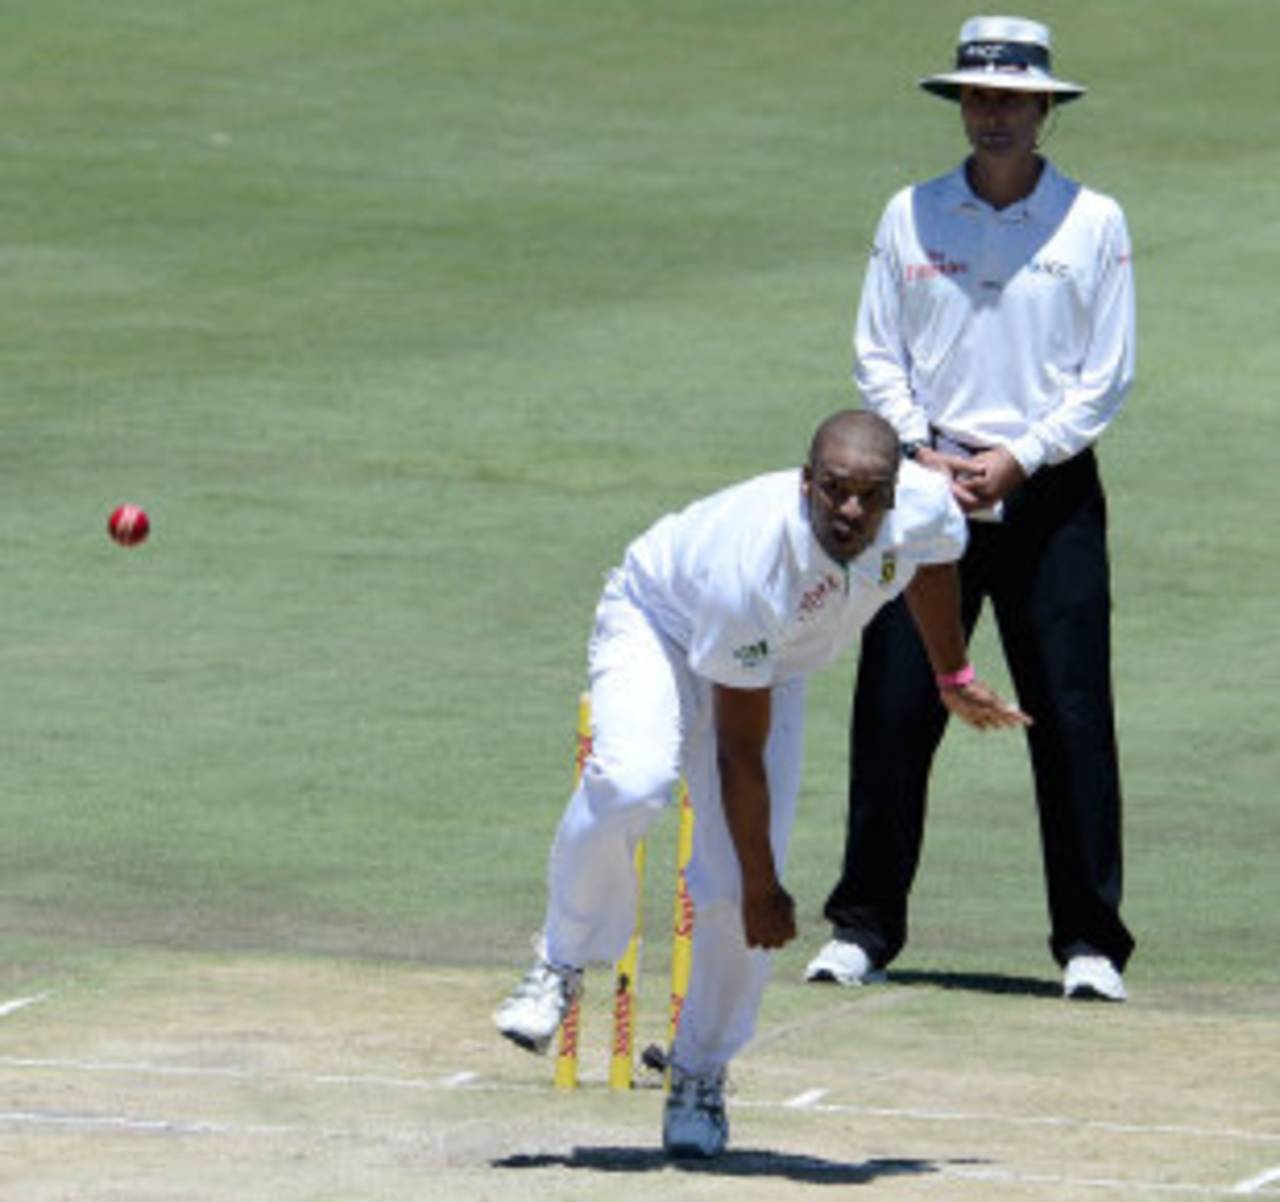
Vernon Philander has been terrific at Newlands, taking 30 wickets in four Tests, including a match haul of 8 for 78 against Australia in 2011 • AFP
Having won the second Test in Port Elizabeth - a venue which was one of their least favourite home grounds before that match - South Africa will be pleased that the decider will be played at Newlands, Cape Town. Since their readmission to international cricket, South Africa have an 18-3 win-loss record here, their second-best among all home venues during this period - in Centurion they've won 14 and lost 2.
The last time South Africa lost a Test match here was in 2006, and their opponents were Australia. The visitors won that Test, the first of the series, by seven wickets, and went on to win that series 3-0. That was Australia's third win in Cape Town in three Tests there since 1992, but after that they've lost twice in succession - a dead rubber in 2009, and a live one in 2011, when they were bowled out for 47 in their second innings. That means Australia's Cape Town record has reduced from 3-0 to 3-2, though they still remain the only side to defeat South Africa in a Test here since 1992.
Since the beginning of 2007, though, South Africa have been unbeaten here, winning eight out of ten Tests, and drawing two, against England in 2010 and India the next year. During this period they've beaten Australia and Pakistan twice each, and have won once each against West Indies, India, Sri Lanka and New Zealand.
The batting and bowling numbers indicate just how dominant South Africa have been at Newlands - they've averaged more than 41 with the bat, and 27 with the ball. Their batsmen have also struck 35 centuries in 26 Tests, an average of 1.35 per Test. Australia's batting and bowling averages are far closer.
| Tests | Won | Lost | Bat ave | Bowl ave | 100s | |
| South Africa, since 1992 | 26 | 18 | 3 | 41.55 | 27.20 | 35 |
| Australia, since 1992 | 5 | 3 | 2 | 32.60 | 31.97 | 4 |
| South Africa, since 2007 | 10 | 8 | 0 | 40.73 | 25.52 | 13 |
South Africa have won the toss in both Tests in the series so far: their decision to insert Australia backfired in Centurion, but the move to bat first worked well in Port Elizabeth. The pitch in Cape Town is expected to be dry, which suggests the captain winning the toss will choose to bat, but the past record here suggests batting first isn't profitable at Newlands. In the last ten Tests here, seven have been won by the team batting second, and only one by the team batting first. That happened when South Africa scored 580 for 4 declared against Sri Lanka in 2012, and then bowled Sri Lanka out for 239 and 342, eventually winning by ten wickets. In that match, though, Sri Lanka had won the toss and chosen to field, perhaps going by the past record at the ground.
Apart from that match, teams have generally struggled in the first innings of Tests there. India scored 414 in 2007 but still ended up losing, while, more recently, New Zealand were bundled out for 45 in 2013. The average runs per wicket in the first innings here is 31.09 since 2007, but excluding the match in which South Africa scored 580 for 4, it's only 26.03, which converts into an average first-innings score of 260.
All five Tests between South Africa and Australia here since 1992 have also been won by the team batting second. South Africa batted first in the first three Tests - in 1994, 2002 and 2006 - and lost each of them, while Australia batted first and were defeated in 2009 and 2011. However, given the conditions that are likely to prevail this time around, the captain winning the toss might still prefer to bat first.
| 1st inngs | 2nd inngs | 3rd inngs | 4th inngs |
| 31.09 | 32.37 | 27.42 | 43.63 |
Graeme Smith has had a lean series so far, scoring 37 from four innings, but he returns to a venue where he scored an unbeaten 101 in a successful fourth-innings run-chase the last time the two teams played here, in 2011. That was his last significant Test innings here - he has scored 65 in four innings since then - but Cape Town's generally been a good venue for him: in 28 innings he has ten scores of 50 or more, and averages 52.11. AB de Villiers and Hashim Amla are the others who've played significant amounts of Tests here, and while both average in the early 40s, their recent form here is far more impressive: in his last four Tests at Newlands Amla has scored 3, 112, 16, 66, 25 and 58, while de Villiers has scored 160 not out, 67, 61 and 36 in his last four innings here.
Among the current members of the Australian squad, there are a couple who've scored centuries here: Michael Clarke scored an outstanding 151 in 2011, and averages 50 here, while Mitchell Johnson scored an unbeaten 123 in 2009, and averages 60.33 with the bat here.
| Batsman | Tests | Runs | Average | 100s/ 50s |
| Graeme Smith | 16 | 1355 | 52.11 | 4/ 6 |
| Hashim Amla | 12 | 827 | 41.35 | 2/ 5 |
| AB de Villiers | 14 | 824 | 41.20 | 2/ 3 |
| Alviro Petersen | 4 | 277 | 46.16 | 2/ 0 |
| Faf du Plessis | 2 | 58 | 19.33 | 0/ 0 |
| Dean Elgar | 2 | 55 | 27.50 | 0/ 0 |
| JP Duminy | 2 | 43 | 14.33 | 0/ 0 |
Among the bowlers, Dale Steyn has been outstanding here (as he has been at most home venues), taking 57 wickets in 11 matches at an average of 21.14. In two Tests against Australia, he has been even more effective, taking 13 wickets at 17.69. Vernon Philander's stats are still better: in four Tests he has 30 wickets, including a match haul of 8 for 78 against Australia in 2011. In his most recent Test here, against Pakistan in February last year, Philander's match figures read 9 for 99, and he has never taken less than six wickets in a Test here.
Among the current bowlers in Australia's squad, Johnson is the only one to play more than one Test here, and his stats are fairly ordinary: five wickets at an average of 47, and an economy rate of 4.39. Shane Watson has played only one Test here, but was superb in South Africa's first innings in 2011, taking 5 for 17 to bundle them out for 96.
| Bowler | Tests | Wickets | Average | Strike rate | 5WI/ 10WM |
| Dale Steyn | 11 | 57 | 21.14 | 45.5 | 1/ 0 |
| Vernon Philander | 4 | 30 | 12.00 | 28.4 | 3/ 0 |
| Morne Morkel | 6 | 24 | 25.91 | 50.4 | 1/ 0 |
| Robin Peterson | 2 | 6 | 34.83 | 68.3 | 0/ 0 |
Overall, pace has been more effective than spin at Newlands, but that's especially true of South Africa's pace attack - opposition fast bowlers have averaged 43 runs per wicket, compared to 23.24 for South Africa's pace attack, which further emphasis the extent to which South Africa have dominated here.
| Wickets | Average | Strike rate | |
| SA - pace | 152 | 23.24 | 49.7 |
| Other teams - pace | 85 | 43.03 | 71.6 |
| SA - spin | 34 | 35.02 | 76.5 |
| Other teams - spin | 42 | 34.47 | 67.1 |
Australia, though, have a pretty potent attack themselves, and with the series at stake, there's plenty of motivation for both teams to be at their best. South Africa haven't won a home series against Australia since their readmission to international cricket, while Australia need to win or draw the series to move past India and become No. 2 in the ICC Test rankings.
S Rajesh is stats editor of ESPNcricinfo. Follow him on Twitter