The most consistent Test batters and bowlers, featuring Mark Richardson, Mohammad Rizwan, Murali and Clarrie Grimmett
A look at the most consistent batters and bowlers in Test history, based on a set of new metrics
Anantha Narayanan
Feb 14, 2026, 4:53 AM • 3 hrs ago
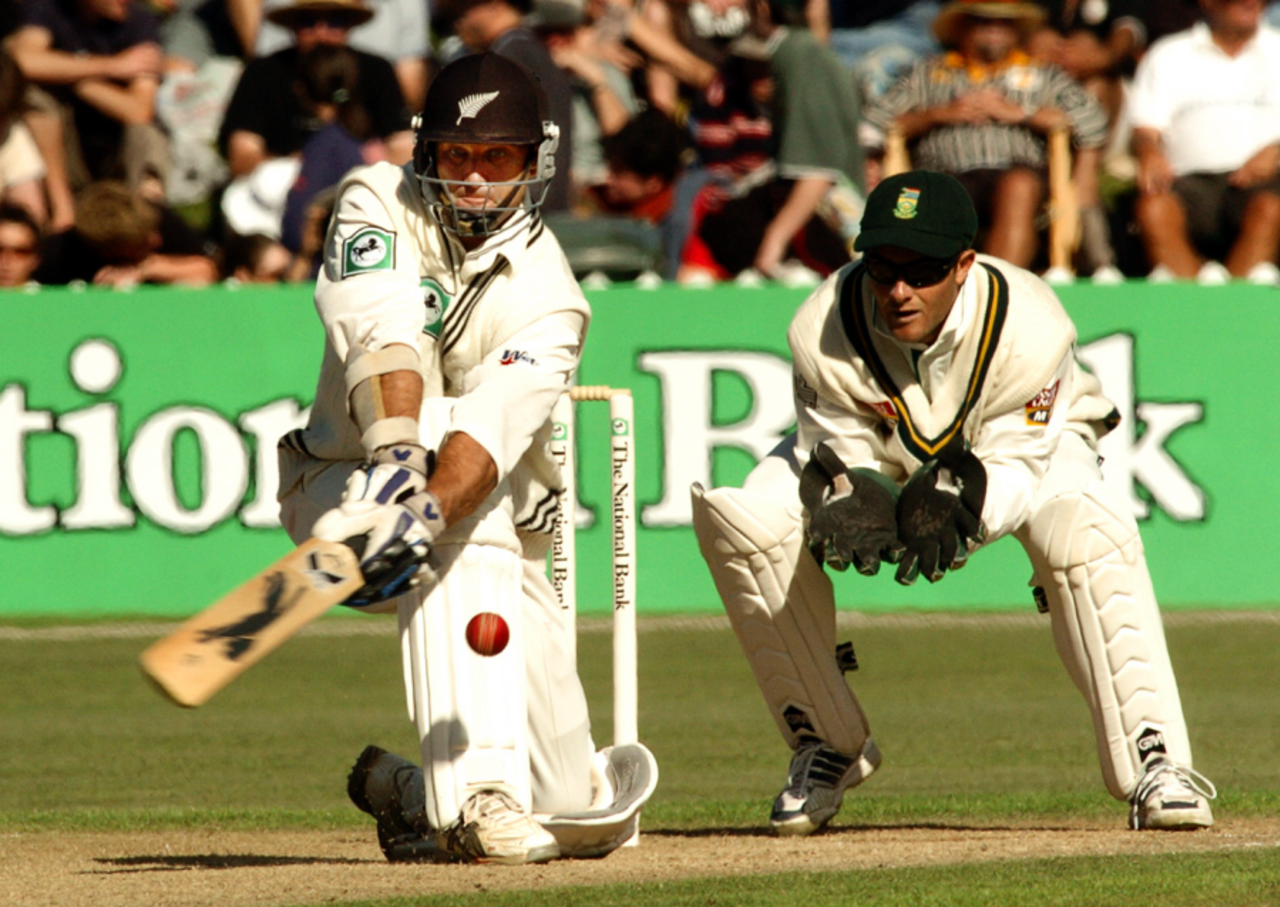
Mark Richardson is nicknamed Rigor [mortis] for his corpse-like batting, but it did make him one of the most consistent batters in men's Test cricket • Ross Setford/Getty Images
What is consistency in cricket? How do we define it? How do we measure it? On what basis do we say one player is consistent and another not? And do we want a consistent player or a brilliant player in our team - that is, is how desirable is consistency as a trait in a player?
These are not easy questions to answer. There is no clear scientific definition of consistency. The term itself is one of many hues. We can only try and define it using common sense as the most important guiding factor.
Let us start with a few examples. Let us say batter A scores 110, 0 and 55 in three innings. batter B scores 70, 25 and 40 in three innings. Batter C scores 35, 40 and 30 in three innings. Simple arithmetic tells us that batter A is the best batter with a Mean (in reality, the Runs per Innings value) average of 55. Batter B is next-best, with an average of 45. Batter C is the worst among this trio, with an average of 35. But common sense tells us that C is the most consistent batter, B is less consistent, and A the least consistent of the three. In the fourth innings A plays, we do not know what to expect - 100, 0, or 50.
What type of batter is a team (or coach or captain) comfortable with? If every batter in the team bats like A, the team could score 500 one day and 100 the next. Filled with batters like C, the team might always get scores between 250 and 350. A team has to have a combination of A, B and C.
In this article I will outline metrics to measure the consistency of players. And these will also be used in my next two articles, where I will attempt to determine the best Test batter and best Test bowler of all time. There will not be room in those articles to explain some metrics, so I will use this article for that purpose.
I will measure consistency as a composite of three sub-metrics - one, an objective derivation; the second, a well-conceived objective compilation; and the third, a common-sense-based derivative.
Measurement of consistency through the Coefficient of Variation
The first sub-metric is based on the ever-dependable concepts of standard deviation (SD) and mean (Runs per Innings). For those who are not familiar with standard deviation, it is a statistical measure which measures the extent of variation of individual values from the average, or mean, value. The SD is calculated using the following formula.
The first sub-metric is based on the ever-dependable concepts of standard deviation (SD) and mean (Runs per Innings). For those who are not familiar with standard deviation, it is a statistical measure which measures the extent of variation of individual values from the average, or mean, value. The SD is calculated using the following formula.
The use of squares and square roots is to take care of the positive and negative variances from the mean. However, it will be obvious that the absolute value of standard deviation will not present us with insights into consistency. This is because the values can vary a lot (due to the differences in the units of measurement). The SD for a batter's career could have a value of around 42 runs, while the SD for a bowler's career could be 2.1 wickets.
Note that the standard deviation and mean are dimensioned variables, which means they are each reliant on a unit of measure - runs for batters and wickets for bowlers. That is where the Coefficient of Variation (CoV) plays an important role. By definition, CoV is equal to standard deviation divided by mean, so it cancels out the unit and is a pure ratio, which makes it perfect to measure the consistency of any distribution - in this case, the career numbers of a player.
It will be obvious to readers by now that the lower the CoV value, the more consistent the player. A low CoV indicates that the values (of scores or wickets) are close to each other, indicating a consistent career. Conversely, the higher the CoV, the less consistent the player is; the values are spread apart, indicating an inconsistent career. Now onwards to the second metric.
Measurement of consistency using career slices
I have always worked on the assumption that a proper evaluation of the consistency of a player cannot be made by analysing only their individual-innings values. Any player will have his days - from outstanding to awful. So I have worked on a common-sense based metric where the canvas is much larger than a single innings.
I have always worked on the assumption that a proper evaluation of the consistency of a player cannot be made by analysing only their individual-innings values. Any player will have his days - from outstanding to awful. So I have worked on a common-sense based metric where the canvas is much larger than a single innings.
Look at career slices, not performances in individual Tests. If I take a five-Test block as a slice, there is enough time across five Tests, played across, say, between three months and a year, to effectively take into account loss of form, varying oppositions, and bad luck.
What I do is to compare the output in each slice with the mean five-Test output of the player across his career. With one caveat: I limit the resulting comparison value for the better performance slices to 1.0.
It is true that a player may play in only one innings in a Test, but Test-based slices are clearer and more well-defined than innings slices, which might start or end during a Test.
Say, a batter plays 27 Tests. That leads to five slices, of which the last one contains seven Tests. Let us say the batter scored 2160 runs in his career, which is an average of 80 runs per Test. So his slice-average base is 400 runs (5 x 80). Let us say that his actual slice outputs are 300, 460, 160, 720 and 520 runs. His performance values will be 0.75, 1.0, 0.4, 1.0, 0.92 (the last value is for seven Tests). The total is 4.07, which leads to an average slice index value of 0.814 - a reasonable consistency level. A value of 0.5 will indicate huge inconsistency, and 0.9 a high level of consistency.
Measurement of consistency using the effective-innings concept
We do not expect a player to score a hundred every innings or take three or four wickets in each; that is too much to expect. So I have lowered the bar. Again, I have gone on pure common sense. I would say that if a batter faces 60 balls or more, or scores 25 runs or more, he has played an effective innings. Those numbers represent batting for around an hour and a half, which translates to a pretty decent effort, and needs to be recognised as such.
We do not expect a player to score a hundred every innings or take three or four wickets in each; that is too much to expect. So I have lowered the bar. Again, I have gone on pure common sense. I would say that if a batter faces 60 balls or more, or scores 25 runs or more, he has played an effective innings. Those numbers represent batting for around an hour and a half, which translates to a pretty decent effort, and needs to be recognised as such.
Let us say that a batter played 150 innings and was effective in 90. His Effectiveness Index is 60% - quite good. If he was effective in only 50, that translates to 33.3%, which makes him quite inconsistent.
For bowlers, I deem an innings as effective if the bowler takes at least one wicket. The caveat here is that I ignore wicketless innings of fewer than five overs. Again common sense comes into play. Fewer than five overs means that the bowler has not even settled down. And the bowler needs to have bowled 30 deliveries or more for a bowling innings to count.
Let us say that a bowler has bowled in 105 innings and five of these lasted 29 balls or fewer. That leaves us with 100 relevant innings. If a bowler has taken at least one wicket in 90 innings out of 100, he is quite consistent. If he has failed to take a wicket in 50 innings out of 100, he is quite inconsistent. And so on.
The bars are set at different levels for batters and bowlers. A batter has to bat for about an hour and a half to reach the effectiveness mark, while a bowler could get a wicket with his first ball. But I make sure that batters and bowlers are each compared only within their own domains in any analysis.
I combine the three Index values explained above to determine my overall Consistency Index.
Onwards to the batting tables. Let me first present the table of Coefficient of Variation values. The top eight and bottom four values have been featured in each table. The qualifying mark is 2000 Test runs (with a stipulation that the 15 batters who make this cutoff but have batting averages below 25 are not considered; this is done to avoid dilution of the tables.) Mostly we lose a number of bowlers who could bat reasonably well (Anil Kumble, Mitchell Starc, Shane Warne et al) and a few allrounders (Richie Benaud, Syd Gregory et al). We lose one keeper, Godfrey Evans, and only one real batter, Mohammad Ashraful. But that is a small price to pay. That leaves us with 333 batters.
In the Test batter run-distribution patterns, the mean normally is quite low and the highest score is between five and ten times the mean. So CoV values tend to be on the higher side.
Mark Richardson tops the table, and he appears quite frequently in this article. This nondescript opener from New Zealand stakes a claim to be anointed the most consistent Test batter of all time with his excellent CoV value. In 38 Tests he accumulated nearly 2800 runs in steady, if unspectacular, fashion. His mean score was nearly 43 and his SD quite low, at 35. This gives him a CoV of 0.82. Herbert Sutcliffe, with a much higher batting average, has a CoV value quite close to Richardson's - 0.83. His Mean was 54 and SD 45. Trevor Goddard has a much lower average but an excellent CoV, 0.84.It is interesting to note that the four batters in positions five to eight all have the same CoV.
At the other end, we have Vinoo Mankad with a huge CoV value of 1.57. His mean score was 29 and the SD a high 46. In the next table, I will bring out the reason for this. Marvan Atapattu, Dennis Amiss, and Guy Whittall complete the bottom quartet. No one should be surprised at Atapattu being here; his was a topsy-turvy career. But Amiss' presence is a surprise.
Next comes the equally important five-Test slice analysis. Remember that I split the batters' career into five-Test slices, determine the runs scored, compare this to the five-Test average runs-scored figure over the career, derive the index value for each slice (limited to 1.0) and then an average slice value. The five-Test Index per cent (first column) is the per cent out of the total number of slices; the value for each slice is added and calculated as a per cent of total slices.
Chris Rogers had an almost perfect career based on this data point. His figures are amazing. He had a career five-Test average of 403 and scored 363, 356, 392, 424, and 480 runs in his five career slices. His five-Test Index is 4.75/5.0, which is an excellent 95.0%. Graham Yallop is nearly as good. With an average five-Test runs figure of 353 over his career, he had slice aggregates of 407, 349, 309, 359, 303, 255, 391, and 383. His five-Test Index was a very high 93.0%.
Mankad, again, features at the other end of the table. His five-Test career average was a low 240; his nine slices totalled 141, 248, 129, 444, 134, 229, 51, 564, and 69 (three Tests). When he scored those daddy hundreds, he flew high. At other times he did virtually nothing. It is no wonder his five-Test Index was a low 69%. He is accompanied in the bottom-four by Tom Blundell, Bill Ponsford, and Zaheer Abbas. The last two are something of a surprise. Although, those who follow Pakistan cricket will know that Abbas alternated double-centuries and strings of failures - as Mankad did.
The table above brings out the simple concept of "effective innings". To have played an effective innings, a batter has to have faced 60 balls or scored 25 runs or remained unbeaten. These numbers mean different things in relation to different batters. For someone like Sutcliffe, batting 60 balls or scoring 25 runs was virtually a failure, while for someone like Wasim Akram, it was a success. But the idea is to have a silver standard for everyone.
Sutcliffe played 84 innings and was effective in 63. That is a fantastic record. Sutcliffe was dismissed in single figures in only 12 innings - simply magnificent, considering that most of the time he opened the innings on the spicy uncovered pitches of his era. Don Bradman clocks in at above 70%. Despite being dismissed seven times for zero, Bradman reached the effective mark 57 times out of 80. Dudley Nourse reached the coveted mark just above two-thirds of the time.
At the other end of the table we have the usual suspects, with Mankad leading again. At his best, he had three innings exceeding 180, including two double-centuries. But he also had 31 single-digit scores, all but three of these ending in dismissals. He was effective in only 25 of his 72 innings. As Richardson is a candidate for the top place overall, Mankad is a sure candidate for the other end of the table. It is of interest to note that Roy McLean, second from the bottom, was third in the five-Test slices table, and almost last here.
Finally we come to the Consistency Index, which is determined by combining the three index values above. The weights for each of the three component values are given below. The five-Test index is very important since that is the most accurate and well-defined metric.
- 4.0 points for the Coefficient of Variation
- 4.0 points for the five-Test Index
- 2.0 points for the Effective Innings Index
The most consistent Test batter is Richardson, with a Consistency Index value of 8.65 points. He is closely followed by Sutcliffe, with 8.49 points. Next comes Mohammad Rizwan of Pakistan, with 8.47 points. In fourth place is Jack Hobbs, very close behind, with 8.45 points. Trevor Goddard completes the top five. It will be of interest that Bradman is in ninth place.
Mankad is the least consistent of the 333 batters considered. His tally of 4.17 points is lower than that of Atapattu by nearly 1.3 points. Abbas is third from bottom. Then come Whittall and Ponsford.
I have only featured a dozen or so batters in each of the preceding table. However, there are 333 qualifying batters and many readers will be interested in perusing the data for them. The complete table, with all four classifications, can be viewed in this Google sheet.
The cut-off for bowlers is 100 wickets. I have included all 203 bowlers who have reached this mark in my analysis. It is not easy to reach this landmark. One has to be a competent and skilful bowler to bowl a thousand overs or more. It is not fair to exclude anyone merely because they conceded more runs. This is unlike with batting, where many bowlers who can bat score a fair tally of runs.
The bowlers are a totally different creed to the batters. Sachin Tendulkar was the highest run-scorer, but on the performance-measures front in this article, he is nowhere at the top. On the other hand, Muralidaran, the top wicket-taker in Test history, is right up there on the performance measures. That includes the Coefficient of Variance. His Wickets-per-Innings value, at 3.48, is the highest among all bowlers. His Standard Deviation is 1.85 and the CoV is a low 0.53, which indicates a very high level of consistency. Charlie Turner follows closely behind with a CoV of 0.56, albeit over just 30 innings, followed by Bill O'Reilly, fast-bowling giant Joel Garner, and Bobby Peel.
The quartet at the bottom of the table is led by Carl Hooper, who took way below a wicket per innings and has a CoV of 1.45. Then follow three other allrounders, of whom the most interesting name might be Ray Illingworth, who, despite being a front-line bowler, had a CoV of 1.16.
The five-Test slice analysis shows some interesting insights. Let us look at table-topper Ryan Harris' career. He played 27 Tests (seven in his last slice). His career average for a five-Test slice is 21 wickets. His five slices produced 20, 21, 26, 18, and 28. That totals to 4.87 and an amazing five-Test index of 97.2%. Michael Kasprowicz's career average for a five-Test slice is 15 wickets. His eight slices produced 14, 14, 17, 14, 15, 20, 12, and seven (three Tests). That totals to 7.73 and a very high five-Test index of 96.6%. O'Reilly and Graham Dilley had index values of 96%. Mehidy Hasan Miraz completes the top five with an excellent index value of 94.5%.
At the other end of the table is Wilfred Rhodes. His long career was full of ups and downs and results in a low Wickets per Slice (WpCS) value of 11 wickets. His 12 slices produced 21, 36, 14, 7, 16, 2, 0, 3, 2, 8, 11, and 7 (three Tests). It is clear that he started as a front-line bowler and didn't quite fulfil that purpose. His index is a low 68%. Then come Hooper, Briggs, and Intikhab Alam. In fifth position is a current bowler, Ben Stokes. He has a low WpCS of 10. But has produced a sine-wave pattern of wicket accumulations in his 24 slices, ranging from 20 to 0 wickets, with a number of single-digit accumulations. His index is a low 78.7%.
Remember that an effective innings is one that produces a wicket and is at least five overs long. Clarrie Grimmett, the doyen of legspinners, had only a single wicketless innings in which he bowled at least five overs. That is indeed remarkable and gives him an index value of 98.4%. Murali, in an 18-year career and 227 qualifying spells, had a zero in his wickets column only nine times - numbers to marvel at. Bruce Reid failed only twice in 40 innings.
We have the usual suspects at the other end. Illingworth and Rhodes are the only two front-line bowlers in the last five. Hooper managed to get above 50% but is last on the table nevertheless.
Now we come to the Consistency Index for bowlers. The same formula is used as explained in the section on batters. That colossus Murali is the most consistent bowler of all time, securing a very high tally of 9.36 points. He is just ahead of O'Reilly, who is just ahead of Turner, who played in the 19th century. Modern giant Kagiso Rabada is in fourth, and Grimmett in fifth. There is a fair representation of modern bowlers at the top in this table.
At the other end we have Hooper again, who had over 100 wickets but was inconsistent. His tally was 4.1 points. He is way behind Rhodes and Trevor Bailey, who follow him. Illingworth and Jacques Kallis, more a batter than bowler, complete the bottom five.
The complete data for all 203 bowlers is available here.
Here are the other new factors used in the analyses in my next two articles:
1. Runs-weighted PQI values
This is a single measure that recognises tough runs scored on difficult pitches. This is computed across the career of each batter. I use PQI (Pitch Quality Index) for this. As most readers know, PQI is one of the most significant measures I have developed, which captures the quality of a pitch - for each half of a match, even, to take care of situations like the Durban Test of 2024 (innings scores of 191, 42, 366 for 5, and 282; PQI values of 18.9 and 61.1). While it is true that Tristan Stubbs' and Temba Bavuma's hundreds won the game for South Africa, Bavuma's first-innings score of 70 came in the far tougher innings.
This is a single measure that recognises tough runs scored on difficult pitches. This is computed across the career of each batter. I use PQI (Pitch Quality Index) for this. As most readers know, PQI is one of the most significant measures I have developed, which captures the quality of a pitch - for each half of a match, even, to take care of situations like the Durban Test of 2024 (innings scores of 191, 42, 366 for 5, and 282; PQI values of 18.9 and 61.1). While it is true that Tristan Stubbs' and Temba Bavuma's hundreds won the game for South Africa, Bavuma's first-innings score of 70 came in the far tougher innings.
I sum the values for "Runs x PQI for match half" for the career of each batter, and divide that number by the career runs. This gives us a single value. Let me call it the Run-weighted PQI value. A low value for this, say 45, indicates that a lot of the runs were scored on very tough pitches, while a high value, say 60, indicates that lots of runs were scored on roads masquerading as pitches. The values for this metric run from 45 to 59; this range, leaning on the higher side of 50, indicates, not surprisingly, that batters tend to do better on better batting pitches.
2. Wicket-weighted PQI values
This is the other side of the coin. In the match above, Marco Jansen's second-innings haul of four wickets on a batter-friendly pitch have to be valued as highly as his seven wickets in the first innings under my Wicket-weighted PQI value metric. A low value on this, say 40, indicates that a lot of the bowler's wickets were taken on helpful pitches, while a high value, say 55, indicates that lots of wickets were taken on batting pitches. The value for this metric ranges from 55 to 37, leaning on the lower side of 50, indicating that bowlers tend to do well on better bowling pitches.
This is the other side of the coin. In the match above, Marco Jansen's second-innings haul of four wickets on a batter-friendly pitch have to be valued as highly as his seven wickets in the first innings under my Wicket-weighted PQI value metric. A low value on this, say 40, indicates that a lot of the bowler's wickets were taken on helpful pitches, while a high value, say 55, indicates that lots of wickets were taken on batting pitches. The value for this metric ranges from 55 to 37, leaning on the lower side of 50, indicating that bowlers tend to do well on better bowling pitches.
3. Run-weighted Bowling Quality
A similar metric is used to evaluate the runs scored off varying bowling attacks. Here, the sum of "Runs x Mean Bowling Average" for all innings by a batter is divided by his career runs to produce the Run-weighted Bowling Average. A low average, such as 25, indicates that the batter has scored tough runs against top-quality bowlers, and vice versa.
A similar metric is used to evaluate the runs scored off varying bowling attacks. Here, the sum of "Runs x Mean Bowling Average" for all innings by a batter is divided by his career runs to produce the Run-weighted Bowling Average. A low average, such as 25, indicates that the batter has scored tough runs against top-quality bowlers, and vice versa.
4. Wicket-weighted Batting Quality
This is the above measure but for bowlers. A high value of, say, 45, indicates that the bowler got his wickets against top-quality batting line-ups and vice versa. This is an excellent measure to assess the quality of batters the bowler bowled to.
This is the above measure but for bowlers. A high value of, say, 45, indicates that the bowler got his wickets against top-quality batting line-ups and vice versa. This is an excellent measure to assess the quality of batters the bowler bowled to.
Potpourri
These are instances of players who performed superbly at an individual level but in losing causes. First, the batters.
- Brian Lara scored 351 Runs (221 and 130). West Indies lost to Sri Lanka, Colombo, 2001
- Andy Flower scored 341 Runs (142 and 199 not out). Zimbabwe lost to South Africa, Harare, 2001
- Herbert Sutcliffe scored 303 Runs (176 and 127). England lost to Australia, Melbourne, 1925
Then the bowlers.
- Ajaz Patel took 14 for 225 (10 and 4). New Zealand lost to India, Mumbai, 2021
- Javagal Srinath took 13 for 132 (5 and 8). India lost to Pakistan, Kolkata, 1999
- Sydney Barnes took 13 for 163 ( 6 and 7). England lost to Australia, Melbourne, 1902
- Merv Hughes took 13 for 217 (5 and 8). Australia lost to West Indies, Perth, 1988
- Tom Richardson took 13 for 244 ( 7 and 6). England lost to Australia, Old Trafford, 1896
Talking Cricket Group
Any reader who wishes to join my general-purpose cricket-ideas-exchange group of this name can email me a request for inclusion, providing their name, place of residence, and what they do.
Any reader who wishes to join my general-purpose cricket-ideas-exchange group of this name can email me a request for inclusion, providing their name, place of residence, and what they do.
Email me your comments and I will respond. This email id is to be used only for sending in comments. Please note that readers whose emails are derogatory will be permanently blocked from sending in any feedback in future.
Anantha Narayanan has written for ESPNcricinfo and CastrolCricket and worked with a number of companies on their cricket performance ratings-related systems