The player(s) of the decade - in numbers
A look at the best players of the decade, in purely numerical terms
|
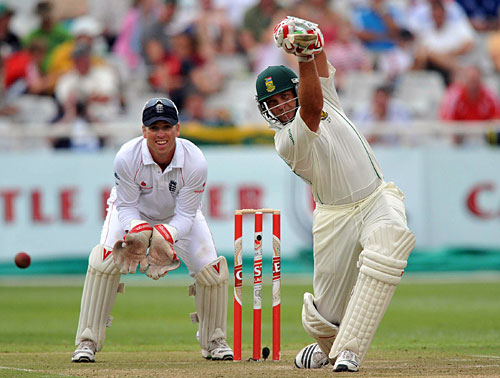
| Jacques Kallis is on top of this list, pipping Ricky Ponting to second place © Getty Images |
I have decided to do a pure numbers-based analysis of the decade from all relevant angles and come with my own list of the top players. This is not to find any holes in the Cricinfo list but to study along with it. Let me say that I have not been asked by Cricinfo to do this and this is on my own initiative.
A typical paragraph in the said article might have run.
"He scored ****** Test runs at a high average of **.**. More than half these runs were scored away. In ODIs his compilation was ****** runs at a middling average of **.** and an outstanding strike rate of ***.*. In addition he picked up a total of *** international wickets at averages way below the average for the decade. His fielding was brilliant and he took *** catches. His team had a better than **% winning record in both Tests and ODIs. He led his team through player change phases very effectively".
Or parts of this paragraph for different players. I have made all efforts to translate each of these "*****"s to measurable and rateable numbers.
Some guidelines.
1. Tests and ODIs will get equal weight (50%/50%). I do not think many would have complaints with this. T20 will not be considered since only around 100 matches have been played.
2. Batting and Bowling will get equal weight (35%/35%). This also should not bother anyone other than those who would oppose this in order to push up their favourite players. However I have always felt that the Bowlers get a raw deal and I will not be a party to that.
3. For key factors such as Runs scored and Wickets captured I will use the unadjusted figures since we are only considering the past 10 years and there have not been many variations during this period.
4. For batting and bowling performance measurements, I will only use the standard accepted measures such as Average, Strike rate, RpO et al. I will not use any derived measures. This makes sense.
5. Fielding, in the form of catches and stumpings, will carry some weight (5%/5%). Oh I know this will benefit the wicket-keepers. I am quite comfortable with that especially as that is the most difficult task on the field.
6. Wins will carry some weight (4%/3%). I know this will elicit complaints from supporters of players whose teams have not performed well. However winning is the most important part of any sport and we have to recognize that.
7. Some weight will be given to captaincy (3%/3%), only in the form of number of matches captained since the previous point would have taken into account the results. The captain clearly shoulders a major additional responsibility in addition to the batting, bowling and wicket-keeping tasks and this factor has to be recognized.
8. For ODIs some weight will be given to success in the major events such as World Cups and ICC Cups (3%). 2 World Cups and 5 ICC Cups were held during this period. After all these are Blue Ribbon events and merit special recognition.
9. Since I will not be taking in the match level performances, I will give some weight (3%/2%) for the number of Man of the Match awards secured. This may not be perfect but is a clear indicator to the contributions by the players towards achieving wins.
10. The period 2000-2009 will be implemented strictly irrespective of mid-series positions.
11. Other than the common-sense based points weight, this will be a completely objective analysis based on known irrefutable facts and no assumptions or derivations.
12. This is an analysis of what was achieved during the decade. Injuries, non-selections, boycotts, home country problems, opt-outs, ICC bans (ICL???), backstage manipulations et al have no relevance here. If I have to make allowance for Tendulkar's injury during early 2000s, I also have to make allowance for the enforced absence of the talented Pakistani players over the past few years. No, those doors are closed. It is what was achieved on the field during the decade which will count.
13. For the purposes of this analysis I have fixed the minimum criteria as either 5000 international (Test+ODI) runs or 200 international wickets. 82 players quailfy. Anyone who misses these numbers is unlikely to be even in the peripheral vision of any jury.
At no stage should the readers forget that the purpose is to find out the Player of the decade, based on all relevant factors, including batting, bowling, fielding, captaincy responsibilities, team performances, successes et al. These are Batting or Bowling analyses.
Let us view the table now. The Players of the decade table is presented bwloe.
No RtgPts  Player                Test     ODI  Cricinfo
Position
1. 57.22  Kallis J.H           31.42   25.80     2
2. 52.18  Ponting R.T          27.21   24.97     1
3. 48.45  Pollock S.M          22.24   26.21
4. 47.62  Muralitharan M       24.84   22.78     4
5. 46.25  Jayasuriya S.T       19.16   27.09
6. 44.69  Tendulkar S.R        19.93   24.75     6
7. 44.27  Gilchrist A.C        21.07   23.20     3
8. 42.83  Gayle C.H            18.23   24.60
9. 41.00  Flintoff A           19.54   21.46
10. 40.31  Lee B                17.53   22.78
11. 40.02  Sehwag V             18.91   21.11
12. 39.97  Vettori D.L          19.87   20.10
13. 39.94  Sangakkara K.C       20.91   19.03
14. 39.78  Jayawardene D.P.M.D  21.80   17.98
15. 39.18  Dravid R             21.73   17.44     9
16. 38.96  McGrath G.D          18.65   20.31     5
17. 37.72  Ganguly S.C          15.33   22.39
18. 37.70  Hayden M.L           21.83   15.87
19. 37.69  Vaas WPUJC           18.03   19.67
20. 37.15  Smith G.C            20.66   16.49
21. 36.58  Warne S.K            22.93   13.65     7
22. 34.72  Harbhajan Singh      16.86   17.87
23. 34.52  Ntini M              17.35   17.16
24. 33.59  Mohammad Yousuf      17.54   16.05
25. 33.45  Clarke M.J           13.42   20.03
- 16490 runs / 399 wickets / 201 ct-st / 209 wins / 34 MOMs / 13 captaincies.
Ricky Ponting has his team successes supporting him and he deserves his second place. Not to forget his own personal contributions towards achieving these wins. He could very well have been on top.
- 18561 runs / 3 wickets / 239 ct-st / 301 wins / 2 WC + 2 ICC wins / 36 MOMs / 318 captaincies.
There is a surprise at the third position. Shaun Pollock shows that he is one of the under-rated all-rounders. The averages and rpo figures are amongst the best of this decade.
- 4731 runs / 535 wickets / 135 ct-st / 181 wins / 23 MOMs / 142 captaincies.
Muralitharan with his tally of 898 wickets is in fourth position. Jayasuriya is in a deserved fifth position with 12527 runs and 205 wickets. Gilchrist with 12373 runs and 759 ct/st dismissals follows. The summary of formulae used. Given below are numbers to get maximum wt values for Tests/ODIs.
Runs:     10000/10000
Wkts:     600/400
BatAvge:  60/60
BowAvge:  20/20
Ct/St:    400/400
Wins:     150/200
Capts:    150/200
MOMs:     16/30
ODI S/R:  1.25 for max
ODI Rpo:  3.0 for max.
To download the complete set of tables, please right-click here and save the file.
I am sure when the esteemed jury voted they took into consideration the non-numerical factors. That would have been the correct thing to do. As such, Ponting, with the type of team building he has done on the field could be comfortably placed at the top. The impact Muralitharan has on Sri Lankan cricket would have propelled him into the third position and the same with Gilchrist, even after retirement. Nothing needs to be said about the colossus, Tendulkar. His mid-table position is certainly justified.
Now it becomes a bit murky. The ignorance of Jayasuriya and Shaun Pollock by the jury is baffling. Until 6 months back Jayasuriya has been magical on the field. Shaun Pollock is as good an all-rounder as Kallis. Kallis might be ahead by a mile in batting but Pollock is in front by three-fourths of a mile in bowling. His accuracy in ODI cricket is legendary. Gayle's continued poor performances under Lara's captaincy might have counted against him. Also he did not have a great test decade. Flintoff was injured too often to be under serious consideration. Brett Lee was also a better ODI bowler than in Tests.
As far as Lara is concerned, he was forced into a hurried retirement by the non-Trinadian-clique at the end of the World Cup, when he had couple of years of top-level Test cricket ahead of him. He still had a pretty good Test decade but his ODI performances during the decade were quite indifferent and I am surprised that one juror even voted him at the top.
Overall I would say the jury did an excellent job. The numbers analysis supports them quite strongly. For once a committee approach has worked very well.
My 1-2-3 ??? Kallis, Ponting, Tendulkar/Muralitharan. Did I hear someone say, only 3. Tough luck, it is my selection. And if you add Gilchrist & McGrath, two of my favourite cricketers, we have the Cricinfo top-6.
Anantha Narayanan has written for ESPNcricinfo and CastrolCricket and worked with a number of companies on their cricket performance ratings-related systems