Test streaks: 52 and 27 matches long
A look at the best batting and bowling streaks in Tests
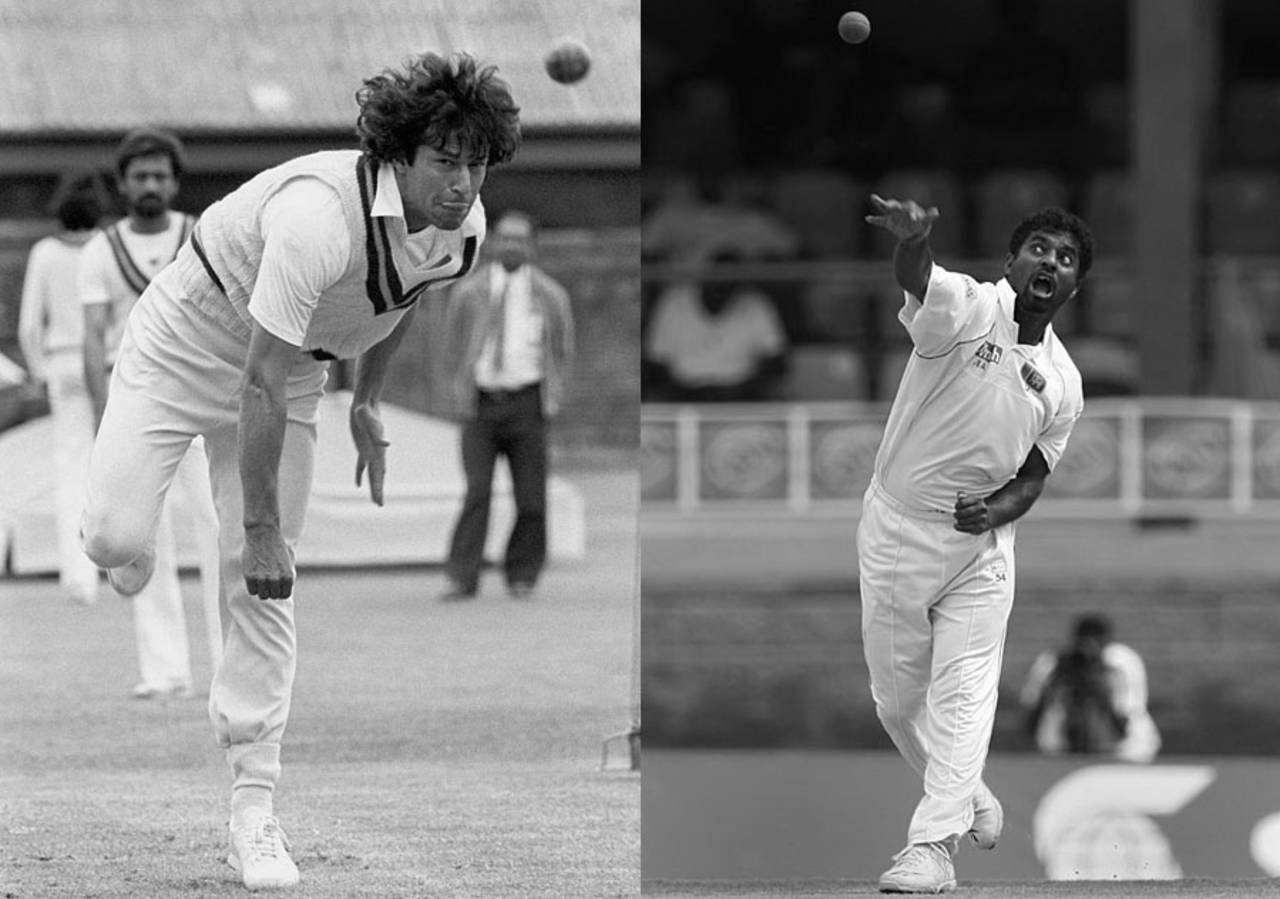
Muttiah Muralitharan got more wickets and Imran Khan averaged better during their peak years than Sydney Barnes - considered the best bowler by his contemporaries - did in his best years • PA Photos/AFP
A few years back I had done an analysis on streaks in Test cricket. I had done this work based on a notional number of consecutive Tests as the streak. Towards the end of the article there was an excellent suggestion that I could use 52 Tests as the basis. Unfortunately since this was a late suggestion, I could not do proper justice to the idea. Also, many current readers would not have seen the earlier article. Hence I have decided to revisit the Test streak scene.
Another important fact is that during the four years, top batsmen like Hashim Amla, AB de Villiers, Kevin Pietersen, Michael Clarke, Alastair Cook, Ross Taylor et al, had their highs and would surely make a significant impact on the tables. On the bowling front, we have Dale Steyn, Saeed Ajmal, Mitchell Johnson, James Anderson, Graeme Swann who have ruled the roost. Hence this article will, I am sure, break new ground.
For batsmen, 52 Tests forms the undisputed cut-off. An Air Guitar for guessing why. The colossus played 52 Tests. Any comparison will be against this number. So I will select only batsmen who have played a minimum of 52 Tests. There are 151 batsmen who qualify. My apologies to those who miss out: to name a few, Everton Weekes, Frank Worrell, Dennis Amiss and Jonathan Trott.
For bowlers, there is an equally dominant figure: Sydney Barnes. He played in 27 Tests only and captured 189 Test wickets, an average of seven wickets per Test. There are 158 bowlers who qualify. So we have a decent population in each category. Let us not forget that each batsman has many streaks of 52 Tests within his career. Sachin Tendulkar had 148 such streaks. Muttiah Muralitharan had 106 qualifying streaks. This means that we have a lot of data available.
Any player's career could be shaded by various textures. Years lost due to war, injuries, non-selections, boycotts, self-imposed exiles, WSC-type series, bans, non-bowling injuries, easy runs/wickets, tough runs/wickets. We have to take all these in our stride and work on the basis that these factors even out across the streaks of between four and 20 years. So this data has a lot going for it. It deserves a lot of respect.
I will be analysing a huge amount of data. However, to make the task of the reader easier, I have created only four relevant tables. For each batsman and bowler, I pick up the best streak embedded within his career. So I reduce tons of data, so to speak, into four tables. Further I will feature in this article the top ten and bottom five players in each table. The complete tables are available for downloading and viewing. The analysis is current up to and including India's historic win over England at Lord's.
| Batsman | Team | Tests | Runs | RpT | Best 52-Test streak | Runs | RpT | Worst 52-Test streak | Runs | Ratio |
|---|---|---|---|---|---|---|---|---|---|---|
| DG Bradman | Aus | 52 | 6996 | 134.5 | 176(1928) - 303(1948) | 6996 | 134.5 | 176(1928) - 303(1948) | 6996 | 100.0 |
| RT Ponting | Aus | 168 | 13378 | 79.6 | 1595(2002)-1819(2006) | 5857 | 112.6 | 1324(1996)-1590(2002) | 3068 | 190.9 |
| BC Lara | Win | 131 | 11953 | 91.2 | 1542(2001)-1816(2006) | 5576 | 107.2 | 1299(1995)-1541(2001) | 3944 | 141.4 |
| Sangakkara | Slk | 125 | 11593 | 92.7 | 1804(2006)-2048(2012) | 5518 | 106.1 | 1504(2000)-1776(2005) | 3764 | 146.6 |
| GS Sobers | Win | 93 | 8032 | 86.4 | 443(1957) - 636(1968) | 5468 | 105.2 | 529(1962) - 738(1974) | 4410 | 124.0 |
| JH Kallis | Saf | 166 | 13289 | 80.1 | 1619(2002)-1856(2007) | 5311 | 102.1 | 1318(1995)-1563(2001) | 3340 | 159.0 |
| Yousuf | Pak | 90 | 7530 | 83.7 | 1513(2000)-1844(2007) | 5247 | 100.9 | 1412(1998)-1726(2004) | 3744 | 140.1 |
| Tendulkar | Ind | 200 | 15921 | 79.6 | 1365(1997)-1631(2002) | 5236 | 100.7 | 1127(1989)-1364(1997) | 3534 | 148.2 |
| L Hutton | Eng | 79 | 6971 | 88.2 | 281(1947) - 386(1954) | 5114 | 98.3 | 276(1946) - 376(1953) | 4643 | 110.1 |
| Jayawardene | Slk | 146 | 11506 | 78.8 | 1709(2004)-1968(2010) | 5102 | 98.1 | 1447(1999)-1699(2004) | 3559 | 143.4 |
| ML Hayden | Aus | 103 | 8626 | 83.7 | 1520(2000)-1723(2004) | 5092 | 97.9 | 1688(2004)-1904(2009) | 3966 | 128.4 |
| GA Gooch | Eng | 118 | 8900 | 75.4 | 1049(1986)-1260(1994) | 5025 | 96.6 | 760(1975)-1044(1986) | 3201 | 157.0 |
| SM Gavaskar | Ind | 125 | 10122 | 81.0 | 683(1971) - 856(1979) | 5007 | 96.3 | 863(1979)-1025(1985) | 3380 | 148.1 |
| ............... | ||||||||||
| HA Gomes | Win | 60 | 3171 | 52.9 | 822(1978)-1045(1986) | 3021 | 58.1 | 839(1979)-1070(1987) | 2658 | 113.7 |
| CG Borde | Ind | 55 | 3061 | 55.7 | 465(1959) - 634(1968) | 3021 | 58.1 | 459(1958) - 631(1968) | 2925 | 103.3 |
| JC Adams | Win | 54 | 3010 | 55.7 | 1188(1992)-1523(2000) | 2995 | 57.6 | 1208(1993)-1527(2001) | 2857 | 104.8 |
| A Ranatunga | Slk | 93 | 5105 | 54.9 | 955(1983)-1293(1995) | 2990 | 57.5 | 1103(1988)-1394(1998) | 2653 | 112.7 |
| GW Flower | Zim | 67 | 3457 | 51.6 | 1285(1995)-1625(2002) | 2872 | 55.2 | 1240(1993)-1581(2001) | 2643 | 108.7 |
I have presented the best 52-Test streak and the worst 52-Test streak. This will enable the readers to see the fluctuations in a batsman's career. It is obvious that the best and worst streaks will be wide apart for players with long careers.
It does not take rocket science to know who would lead the table. As day follows night follows day, one DG Bradman, the "Boy from Bowral" is certain to be there at the top with 6996 runs. No need to describe Bradman other than to say that he stands supreme and in a separate zone of his own. This streak, also coinciding with his career, lasted just under 20 years. If those seven years had not been lost, would Bradman have reached 10,000 runs at 100 or ended his career with 6000 at 90? There are no answers.
What is important is the collection of modern greats who come after Bradman. Ricky Ponting's purplest of patches lasted just under five years and he accumulated nearly 6000 runs. Against a career RpT (Runs per Test) value of 80, he scored over 110 runs per Test during this period. He was within 17% of Bradman in his aggregate. This is a magnificent achievement considering that most measures place the second-placed batsman at around 40% below Bradman.
He is followed by another modern great. Brian Lara scored over 5500 runs during his heyday of five and a half years. Since his career RpT is itself a high 91, the accumulation of 107 does not seem that high. Another significant fact is that this was achieved virtually towards the end of Lara's career.
Kumar Sangakkara's recent form has been outstanding and this is shown by his six-year accumulation of just over 5500 runs. Garry Sobers completes the top five with an aggregate of nearly 5500 runs. However this took over ten years, indicating the paucity of Tests during the '50s and '60s.
Jacques Kallis, Mohammad Yousuf, Sachin Tendulkar, Len Hutton and Mahela Jayawardene complete the top ten. Hutton is the only batsman belonging to the earlier generation. Three other batsmen, Matthew Hayden, Graham Gooch and Sunil Gavaskar, are featured here since they accumulated over 5000 Test runs during the 52-Test streak.
It can be seen that where the batsmen have had careers close to 52 Tests, their career RpT and the best streak RpT are close. However, where the batsman has played in many Tests, such as Tendulkar, Ponting et al, there is a wide gap between the values.
The years that the concerned player took to complete this streak is of interest. For the older players we have periods exceeding 20 years. Bradman was close to this figure. Some of the modern players have achieved this in four years. For the record, Jack Hobbs took 21 years to play 52 Tests. Hayden took only four years to play the same number of Tests.
A tweak was necessary to present a meaningful bottom-five batsmen. The last part of the table is full of allrounders and wicketkeepers. Hence I have selected five players who played purely as batsmen. Grant Flower accumulated only 2872 runs in his best streak. The other four batsmen - Arjuna Ranatunga, Jimmy Adams, Chandu Borde and Larry Gomes - also aggregated only around 3000 runs in their best streak of 52 Tests.
Ponting's best streak is nearly twice as productive as his worst streak. It is of interest to note that only Daniel Vettori, with a ratio of 250%, has a wider variance. This indicates the topsy-turvy nature of Ponting's career. Most other players with long careers are around the 150% mark, with Kallis' 159% being quite high. Steve Waugh has a ratio of 170%. It is interesting to note that Tendulkar's best streak starts right at the end of his worst.
| Batsman | Team | Tests | Runs | Career RpFI-MA | Best 52-Test streak | Inns | Unf-Nos | Runs | Streak RpFI-MA |
|---|---|---|---|---|---|---|---|---|---|
| DG Bradman | Aus | 52 | 6996 | 89.50 | 176(1928) - 303(1948) | 80 | 4 | 6996 | 89.50 |
| RT Ponting | Aus | 168 | 13378 | 47.72 | 1595(2002)-1819(2006) | 92 | 9 | 5857 | 66.50 |
| GS Sobers | Win | 93 | 8032 | 51.33 | 443(1957) - 636(1968) | 88 | 5 | 5468 | 63.27 |
| Sangakkara | Slk | 125 | 11593 | 55.22 | 1804(2006)-2048(2012) | 91 | 3 | 5518 | 61.82 |
| Yousuf | Pak | 90 | 7530 | 48.96 | 1513(2000)-1844(2007) | 87 | 3 | 5247 | 61.44 |
| Tendulkar | Ind | 200 | 15921 | 49.49 | 1365(1997)-1631(2002) | 88 | 4 | 5236 | 60.81 |
| BC Lara | Win | 131 | 11953 | 51.85 | 1542(2001)-1816(2006) | 93 | 0 | 5576 | 59.96 |
| Richards | Win | 121 | 8540 | 47.55 | 767(1976) - 987(1984) | 76 | 0 | 4514 | 59.39 |
| JH Kallis | Saf | 166 | 13289 | 48.44 | 1619(2002)-1856(2007) | 91 | 5 | 5311 | 59.26 |
| JB Hobbs | Eng | 61 | 5410 | 54.55 | 102(1909) - 194(1930) | 85 | 3 | 4897 | 59.23 |
| ML Hayden | Aus | 103 | 8626 | 48.57 | 1520(2000)-1723(2004) | 91 | 6 | 5092 | 58.53 |
| de Villiers | Saf | 93 | 7240 | 47.70 | 1871(2008)-2119(2014) | 82 | 4 | 4644 | 58.25 |
| R Dravid | Ind | 164 | 13288 | 47.73 | 1515(2000)-1765(2005) | 86 | 5 | 4883 | 58.21 |
| Jayawardene | Slk | 146 | 11506 | 47.73 | 1709(2004)-1968(2010) | 89 | 4 | 5102 | 58.18 |
| Miandad | Pak | 124 | 8832 | 47.72 | 945(1983)-1130(1989) | 73 | 1 | 4240 | 58.14 |
| ............... | |||||||||
| CG Borde | Ind | 55 | 3061 | 32.60 | 465(1959) - 634(1968) | 92 | 7 | 3021 | 34.07 |
| AJ Lamb | Eng | 79 | 4656 | 33.87 | 978(1984)-1163(1991) | 91 | 3 | 3033 | 33.91 |
| BE Congdon | Nzl | 61 | 3448 | 30.71 | 583(1965) - 818(1978) | 96 | 2 | 3171 | 33.65 |
| GM Wood | Aus | 59 | 3374 | 31.11 | 816(1978)-1021(1985) | 99 | 3 | 3081 | 31.96 |
| GW Flower | Zim | 67 | 3457 | 28.41 | 1285(1995)-1625(2002) | 98 | 2 | 2872 | 29.71 |
This table is ordered on the batting measure, "Runs per Fulfilled Innings - Milind-Ananth" (RpFI-MA). This is Milind's version of handling the non-fulfilled innings and has been discussed a few times already in my earlier articles. He has referred to this measure as 'µ' in his blogs. To recapitulate in a simple manner, we expand, in an indirect manner, all not out innings which are below the Out-Average to the Out-Average. This ensures that scores like 5*, 15* and 20* do not lower the RpI figures drastically. This method takes care of the problem in Batting Average with middle order batsmen remaining unbeaten in 15-20% of the innings they played in.
I have given the example of Bradman to illustrate this calculation. The average of the 70 innings in which he was dismissed is 83.83 (5868/70). His 10 not-outs are 37*, 299*, 103*, 144*, 102*, 56*, 127*, 57*, 30* and 173*. Out of these ten innings, six are higher than 83.83 and are considered "fulfilled innings". It is clear why. These innings have gone past the Out-Average. The other four innings - 37*, 56*, 57rh and 30* - are indirectly extended to the Out-Average, by tweaking the number 4 to a lower value 2.147(180/83.83). The value of RpFI-MA for Bradman is 6996/(76+2.147) which works out to 89.50. Hats off to Milind's awareness for maximum computing correctness.
It should be noted that the RpFI-MA value is derived for each streak and the best one presented here.
The first entry is the expected one. 99.94 would have been more easily recognisable. But let us start looking at Bradman's RpFI-MA figure carefully since that would appear quite frequently hereafter. The RpFI-MA is 89.50. Ponting continues to be in second place with an excellent RpFI-MA of 66.5. This is about 25% off Bradman's average and firmly places Ponting's streak on a fairly high pedestal.
Then we have changes from the earlier table. The increased number of not-outs, which are inherent in any middle order batsman's career, propels Sobers, with a RpFI-MA figure of 63.3 into third place. Sangakkara remains in the top five with 61.8 and the top five is completed by Yousuf, with 61.4.
Next in the list are the two modern legends: Tendulkar and Lara, who have almost identical figures either side of 60. Viv Richards is a surprise entry into the top ten. Kallis and Hobbs complete the top ten.
Grant Flower is comfortably propping up the table with a fairly low value of 29.7. Again, let me remind you that I have ignored allrounders and wicketkeepers. We also have four other batsmen who promised a lot but did not deliver much. Especially Graeme Hick.
| Bowler | Team | Tests | Wkts | WpT | Best 27-Test streak | Wkts | WpT | Worst 27-Test streak | Wkts | WpT | Ratio |
|---|---|---|---|---|---|---|---|---|---|---|---|
| Muralitharan | Slk | 133 | 800 | 6.0 | 1670(2003)-1820(2006) | 205 | 7.6 | 1195(1992)-1359(1997) | 101 | 3.7 | 203.0 |
| SF Barnes | Eng | 27 | 189 | 7.0 | 65(1901) - 133(1914) | 189 | 7.0 | 65(1901) - 133(1914) | 189 | 7.0 | 100.0 |
| Younis | Pak | 87 | 373 | 4.3 | 1151(1990)-1268(1994) | 177 | 6.6 | 1442(1999)-1617(2002) | 82 | 3.0 | 215.9 |
| SK Warne | Aus | 145 | 708 | 4.9 | 1615(2002)-1763(2005) | 173 | 6.4 | 1405(1998)-1556(2001) | 93 | 3.4 | 186.0 |
| RJ Hadlee | Nzl | 86 | 431 | 5.0 | 959(1983)-1072(1987) | 164 | 6.1 | 710(1973) - 873(1980) | 118 | 4.4 | 139.0 |
| MD Marshall | Win | 81 | 376 | 4.6 | 991(1984)-1100(1988) | 161 | 6.0 | 837(1978) - 988(1984) | 109 | 4.0 | 147.7 |
| DK Lillee | Aus | 70 | 355 | 5.1 | 790(1977) - 908(1981) | 160 | 5.9 | 876(1980) - 955(1983) | 129 | 4.8 | 124.0 |
| CV Grimmett | Aus | 37 | 216 | 5.8 | 195(1930) - 251(1936) | 159 | 5.9 | 166(1926) - 234(1934) | 138 | 5.1 | 115.2 |
| DW Steyn | Saf | 73 | 371 | 5.1 | 1830(2007)-1951(2010) | 157 | 5.8 | 1913(2009)-2056(2012) | 129 | 4.8 | 121.7 |
| R Benaud | Aus | 63 | 248 | 3.9 | 431(1956) - 507(1961) | 157 | 5.8 | 347(1952) - 433(1956) | 73 | 2.7 | 215.1 |
| Imran Khan | Pak | 88 | 362 | 4.1 | 909(1981)-1058(1986) | 154 | 5.7 | 1067(1987)-1182(1992) | 78 | 2.9 | 197.4 |
| A Kumble | Ind | 132 | 619 | 4.7 | 1574(2001)-1724(2004) | 153 | 5.7 | 1247(1994)-1387(1997) | 87 | 3.2 | 175.9 |
| AK Davidson | Aus | 44 | 186 | 4.2 | 449(1958) - 537(1963) | 151 | 5.6 | 372(1953) - 483(1959) | 92 | 3.4 | 164.1 |
| ............... | |||||||||||
| Bracewell | Nzl | 41 | 102 | 2.5 | 891(1980)-1093(1988) | 71 | 2.6 | 1000(1984)-1138(1990) | 59 | 2.2 | 120.3 |
| Razzaq | Pak | 46 | 100 | 2.2 | 1584(2002)-1809(2006) | 67 | 2.5 | 1487(2000)-1716(2004) | 48 | 1.8 | 139.6 |
| TE Bailey | Eng | 61 | 132 | 2.2 | 386(1954) - 440(1957) | 66 | 2.4 | 334(1951) - 412(1955) | 44 | 1.6 | 150.0 |
| RJ Shastri | Ind | 80 | 151 | 1.9 | 962(1983)-1054(1986) | 63 | 2.3 | 1063(1986)-1177(1991) | 37 | 1.4 | 170.3 |
| CL Hooper | Win | 102 | 114 | 1.1 | 1364(1997)-1553(2001) | 45 | 1.7 | 1096(1988)-1174(1991) | 11 | 0.4 | 409.1 |
For bowlers also, I have presented the best 27-Test streak as also the worst 27-Test streak. It is to be expected that the bowlers will have much wider fluctuations between their best and worst streaks. This can be seen later.
What do we have here? We would have expected Barnes, with his career average of seven wickets per Test, sitting comfortably at the top. No, not this time. Murali, that Lankan wizard, has comfortably overtaken Barnes and is perched on top with 205 wickets in 27 Tests during the 2003-2006 period. An extraordinary WpT figure of 7.6.
Do I hear the words Bangladesh and Zimbabwe and home conditions in Sri Lanka? I am a firm believer in the axiom that a Test wicket is a Test wicket. There have been weak teams right through the 137 years of Test cricket. Surely Bangladesh and Zimbabwe are no worse than many teams during the 1930s, 1950s, 1960s? Even many established teams were poor. How many 5-0 drubbings have teams endured? Not to forget the uncovered pitches during the first few decades of Test cricket. So let us keep our views upright and not try to belittle one player or group of players. One day I should do an analysis to prove the point I have briefly talked about.
The next five bowlers are contemporary greats. How else can one describe Waqar Younis, Shane Warne, Richard Hadlee, Malcolm Marshall and Dennis Lillee? All these bowlers have accumulated in excess of 160 wickets in their prime stretch of 27 Tests. A special mention should be made of Marshall, who has averaged around six wickets per Test in his prime despite the presence of so many world-class bowlers in his team.
The top ten is completed by Clarrie Grimmett, the surprise package - Richie Benaud - and Steyn. Benaud is indeed a surprise. To have accumulated over 150 wickets is praiseworthy and should let us revise our opinion of him.
Bill O'Reilly's 27 Tests took over 14 years since he played one Test after the war and this Test completed the tally of 27 Tests. Erapalli Prasanna took over 11 years to play 27 Tests. Mitchell Johnson, Tony Greig and Andrew Flintoff took less than two years to play the 27 Tests.
As has happened often, Ravi Shastri and Carl Hooper prop up the table with very poor aggregates below 65 wickets. Not one of these five is a pure bowler.
Wilfred Rhodes is in a freak situation. He went through a 27-Test streak with 95 wickets and another 27-streak with 15 wickets. Sobers had very striking contrasting streaks with 104 and 24 wickets respectively. Kallis has similar figures. The first real surprise is Ian Botham. He picked up 146 and 57 wickets respectively in his best and worst streaks. Murali picked up 205 and 101 wickets respectively. Thus it can be seen that about ten bowlers have ratios more than 200%. Surprisingly, despite the non-bowling Tests, Imran Khan finishes with 154 and 78 wickets respectively.
| Bowler | Team | Tests | Wkts | Avge | Best 27-Test streak | Wkts | BowAvge |
|---|---|---|---|---|---|---|---|
| Imran Khan | Pak | 88 | 362 | 22.81 | 909(1981)-1058(1986) | 154 | 14.85 |
| SF Barnes | Eng | 27 | 189 | 16.43 | 65(1901) - 133(1914) | 189 | 16.43 |
| MD Marshall | Win | 81 | 376 | 20.95 | 991(1984)-1100(1988) | 161 | 17.09 |
| Waqar Younis | Pak | 87 | 373 | 23.56 | 1151(1990)-1268(1994) | 177 | 17.32 |
| JC Laker | Eng | 46 | 193 | 21.25 | 383(1954) - 464(1959) | 126 | 17.49 |
| J Briggs | Eng | 33 | 118 | 17.75 | 23(1886) - 62(1899) | 118 | 17.64 |
| Muralitharan | Slk | 133 | 800 | 22.73 | 1670(2003)-1820(2006) | 205 | 18.15 |
| CEL Ambrose | Win | 98 | 405 | 20.99 | 1144(1990)-1257(1994) | 140 | 18.16 |
| RJ Hadlee | Nzl | 86 | 431 | 22.30 | 959(1983)-1072(1987) | 164 | 18.46 |
| AV Bedser | Eng | 51 | 236 | 24.90 | 317(1949) - 389(1954) | 149 | 18.56 |
| AK Davidson | Aus | 44 | 186 | 20.53 | 449(1958) - 537(1963) | 151 | 18.95 |
| Wasim Akram | Pak | 104 | 414 | 23.62 | 1134(1990)-1268(1994) | 149 | 19.24 |
| IT Botham | Eng | 102 | 383 | 28.40 | 806(1977) - 881(1980) | 146 | 19.30 |
| SM Pollock | Saf | 108 | 421 | 23.12 | 1380(1997)-1475(1999) | 130 | 19.38 |
| AA Donald | Saf | 72 | 330 | 22.25 | 1320(1995)-1437(1998) | 148 | 19.72 |
| RGD Willis | Eng | 90 | 325 | 25.20 | 780(1976) - 836(1978) | 117 | 19.89 |
| ............... | |||||||
| Rafique | Bng | 33 | 100 | 40.76 | 1512(2000)-1832(2007) | 91 | 36.37 |
| AF Giles | Eng | 54 | 143 | 40.60 | 1606(2002)-1728(2004) | 81 | 36.38 |
| CL Hooper | Win | 102 | 114 | 49.43 | 1364(1997)-1553(2001) | 45 | 36.60 |
| DVP Wright | Eng | 34 | 108 | 39.11 | 263(1938) - 326(1950) | 90 | 39.39 |
| RJ Shastri | Ind | 80 | 151 | 40.96 | 962(1983)-1054(1986) | 63 | 39.44 |
I was almost certain that the average of Barnes would be the best, even though he was upstaged in the wickets tally by Murali. But there is another bowling giant who firmly shuts the door on Barnes. Imran Khan captured 154 wickets in the five-year period around early eighties at an unbelievable average of 14.85. Yes, that is true. This is the sort of average the demon bowlers around the turn of the 19th century used to get, bowling on uncovered wickets against teams new to Test cricket. I have carefully pondered over this. In my opinion the numbers of Murali and Imran Khan are two of the greatest bowling achievements ever. Imran's career figures changed from 128 at 29.45 to 282 at 21.48 during this memorable period.
The next three bowlers are Marshall, Younis and Jim Laker. All are wonderful bowlers. After Johnny Briggs appears Murali, who has an average of 18.15. Not bad for a spinner. Both Younis and Akram find a place in the top 12. What a period for Pakistan. Between 1990 and 1994, they had these two stalwarts picking up 320 wickets at an average of around 17.
The usual culprits prop up the table, including the ever-present table-proppers, Shastri and Hooper.
There is a case for increasing the bowling cut-off to a higher number of Tests. However, I am satisfied with this: after all 27 Tests have produced 150 wickets and more.
What do we conclude? Bradman was supreme, there has been no doubt about it and this analysis confirms this view. In his long career, scarred by six years of war and deliberate bodyline attack, he accumulated nearly 20% more runs at 25% higher RpFI-MA value than the next player who was playing at his prime. This one sentence confirms that his zone was beyond all other players' zones. This is the one analysis where there is a smaller gap between the master and the next best, Ponting. He is only around 20% off. Let us give him due credit. Lara and Sangakkara also stand out.
Murali, on the aggregate front, and Imran, on the average measure, have upstaged Barnes, considered by many to be one of the greatest, with career figures expected to be unreachable. That too, in modern conditions. Maybe all of us must give the modern bowlers their credit. We tend to put the batsmen on a pedestal and do not give the bowlers their right due.
An interesting add-on observation from Milind. If we define an alternate measure of consistency of a batsman as the ones with the lowest ratios, which would be close to 100%, between best and worst streaks (min 78 Tests considered - to have a career at least 150% of the streak length), then the top batsmen are given below.
NJ Astle (106.9%), MS Dhoni (109.4%), L Hutton (110.1%), GC Smith, N Hussain, Richardson, RJ Hadlee, GS Chappell, IR Bell, A Ranatunga, Tillakaratne, A Flintoff, Barrington, MW Gatting, Abbas, AJ Lamb, RB Kanhai (114.8%). A nice nugget: thank you, Milind.
The names that appear here which were well-placed in my earlier Consistency analysis are Hutton, Ken Barrington and Rohan Kanhai.
I have uploaded the Table containing the four full tables. To download/view this file, please CLICK HERE.
Anantha Narayanan has written for ESPNcricinfo and CastrolCricket and worked with a number of companies on their cricket performance ratings-related systems