Australia's trial by spin
Spin - both facing it and bowling it - has been a challenge for Australia on their previous tours to India. How well will they cope this time?
S Rajesh
20-Feb-2013
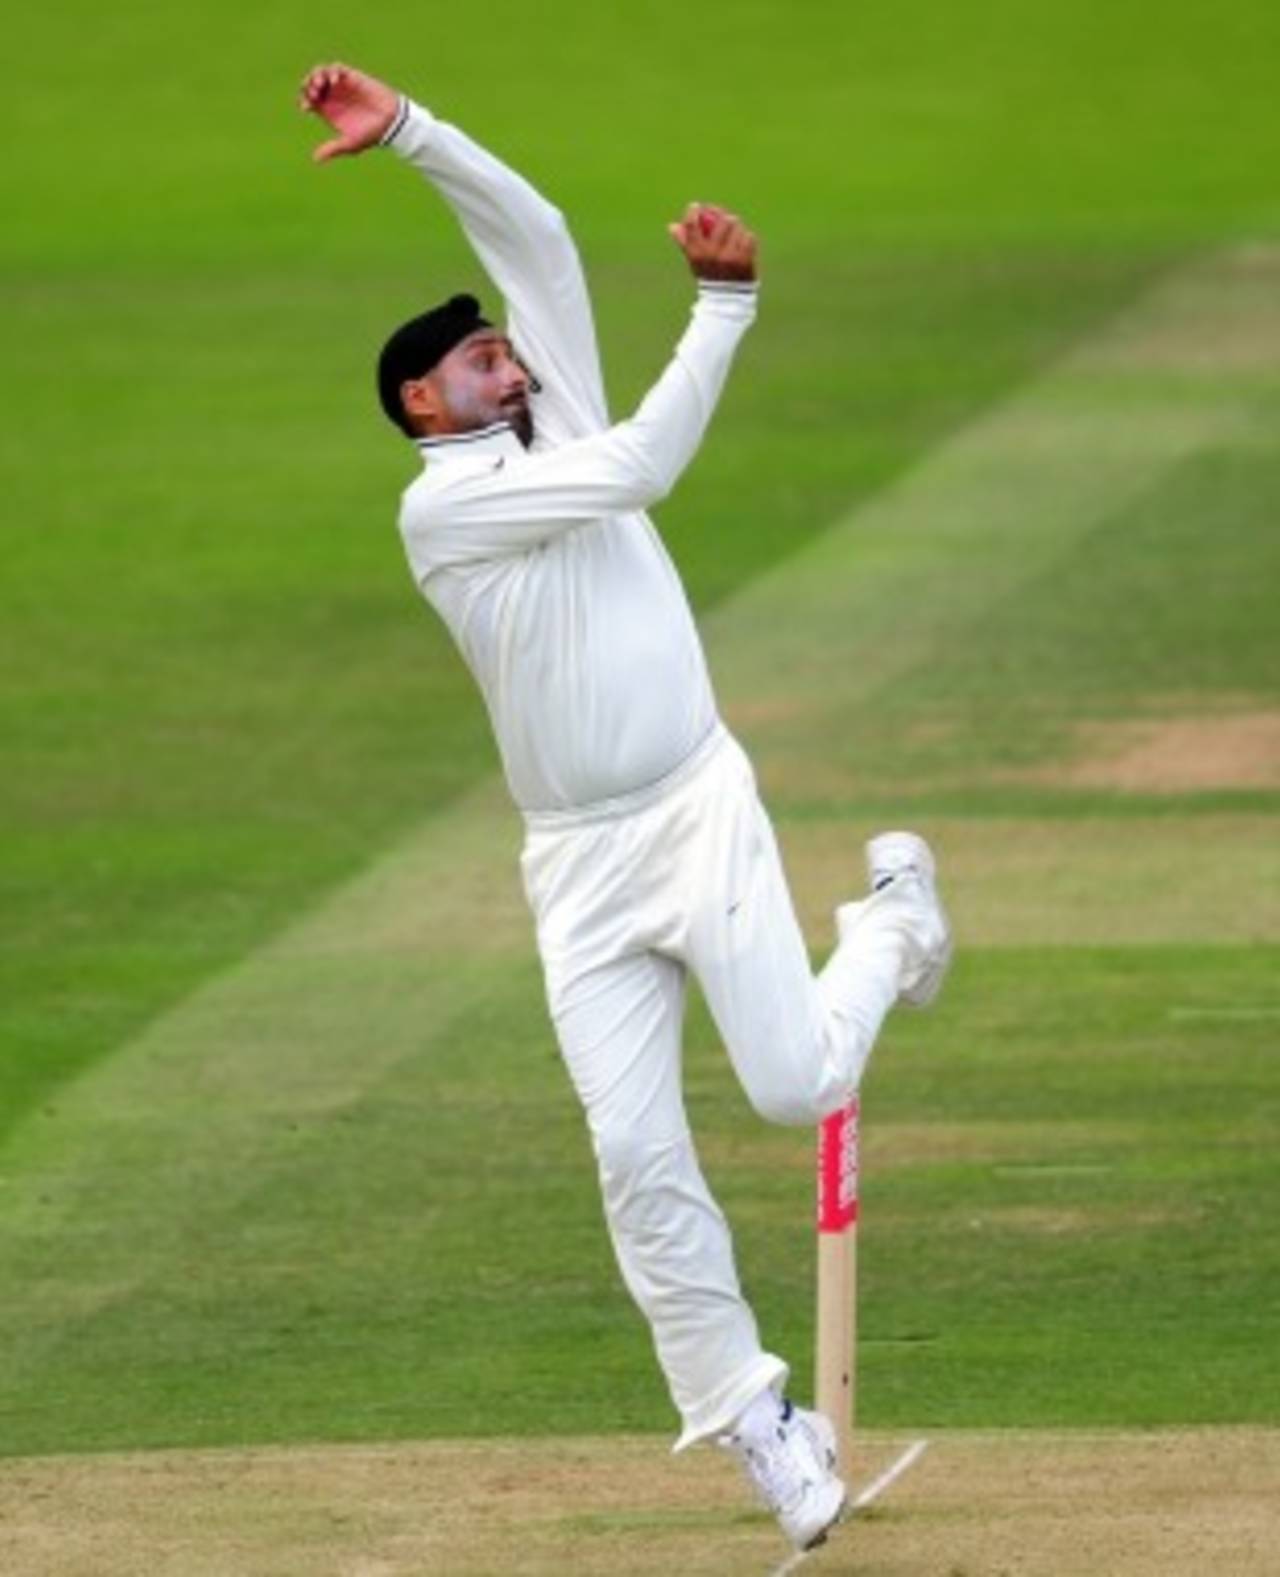
Of the 15 five-fors by Indian spinners in home Tests against Australia since 1995, seven have belonged to Harbhajan Singh • Getty Images
An Australian line-up with only four players who've experienced Test cricket in India before will attempt to achieve something that only three other sides have managed in 23 series since 2000. When England trumped India 2-1 in the four-Test series late last year, they became the third team - after Australia in 2004 and South Africa in 2000 - to win a Test series in India since 2000. Despite India's Test fortunes being on a downward slide in the last 20 months, it'll be a tough ask for Australia to replicate what England achieved: England had two high-quality spinners, and a settled and experienced batting line-up; Australia's spin attack looks far inferior when compared to the Graeme Swann-Monty Panesar combination, while their batting line-up is still grappling with the retirements of two heavyweights, Ricky Ponting and Michael Hussey.
The India-Australia historical head-to-head shows two distinct sets of numbers, depending on the country hosting the matches. In Australia, India have struggled to notch up victories, losing five Tests for every one they've won. At home, though, they've won more than they've lost, and have been especially dominant in the last few years, winning ten out of 17 since the beginning of 1996.
The average columns indicate that Australia tend to slip up in both aspects, the batting and the bowling, when they tour. At home against India, they average 39 with the bat and 29.49 with the ball; in tours to India since 1995, the batting average has dipped to less than 32, and the bowling one has gone up to more than 37.
In these 17 Tests in India, Australian batsmen have scored more hundreds than the Indians - 16 to 15 (though their batsmen have also batted 28 more times). However, they've also been dismissed cheaply more often, getting out for 20 or less 178 times, compared to 151 for India.
| Tests | Aus won | Ind won | Drawn | Bat ave-Aus | Bat ave-Ind | |
| Overall | 82 | 38 | 20 | 23 | 35.42 | 30.89 |
| in Australia | 40 | 26 | 5 | 9 | 39.00 | 29.49 |
| in India | 42 | 12 | 15 | 14 | 32.15 | 32.42 |
| in India since 1995 | 17 | 4 | 10 | 3 | 31.59 | 37.21 |
Three teams have done significantly better than Australia when they've toured India, of which two are South Africa and England, teams you'd expect should also struggle to play spin. South Africa have won as many Tests as they've lost, and they're the one team whose batting average is higher than the bowling one. For Australia, the bowling average is more than five runs higher than the batting average.
| Team | Tests | Won/ lost | Ratio | Bat ave | Bowl ave |
| Pakistan | 9 | 3/ 3 | 1.00 | 34.00 | 39.09 |
| South Africa | 12 | 5/ 5 | 1.00 | 35.67 | 31.58 |
| England | 12 | 3/ 4 | 0.75 | 34.60 | 35.12 |
| Australia | 17 | 4/ 10 | 0.40 | 31.59 | 37.21 |
| New Zealand | 13 | 0/ 5 | 0.00 | 30.93 | 45.79 |
| Sri lanka | 9 | 0/ 4 | 0.00 | 34.20 | 46.93 |
| West Indies | 6 | 0/ 4 | 0.00 | 27.83 | 44.03 |
| Zimbabwe | 4 | 0/ 3 | 0.00 | 33.01 | 64.08 |
Australia's susceptibility against spin was on display in their warm-up game against India A, and traditionally too they haven't handled spin all that well in India. Since 1995, Indian spinners have averaged 29.05 runs per wicket against Australia in 17 Tests, their third-best against any team during this period. England and South Africa have the best stats against India's spinners, but while England's batsmen have performed relatively poorly against India's seamers, South Africa have done well against them too. Australia's stats against pace is pretty good in India, but they've succumbed to spin pretty regularly: 15 times India's spinners have taken five-fors against them in 17 Tests.
Almost half of those 15 five-fors have been taken by Harbhajan Singh, which explains his inclusion into the Indian squad despite not having lived up to his reputation in the domestic season. In 12 home Tests against Australia, Harbhajan has taken 81 wickets at 24.48. Anil Kumble was equally spectacular as well, with 62 wickets in ten Tests at 24.46, but in his absence, it remains to be seen if Harbhajan can be equally effective.
Among the current Australian batsmen, Michael Clarke and Shane Watson are the two batsmen who've faced the Harbhajan threat in Tests in India. Clarke has the better stats against him, scoring 132 runs at an average of 44, while Watson averages 31. Both have pretty low scoring rates against him, with Watson scoring only 93 runs in 273 balls.
Australia will also miss the experience of Ponting and Hussey, especially when it comes to handling Harbhajan. Ponting struggled against Harbhajan in 2001, but did much better thereafter, scoring 148 runs and being dismissed only twice. Hussey scored 136 off Harbhajan and was dismissed three times. In their absence much of the batting onus will be on Clarke, and though he scored a century in his first Test innings in India - which was also his debut - his overall numbers in India are disappointing: 686 runs in 19 innings at 38.11. Watson has done slightly better, averaging 40.09 in 11 innings.
| Opposition | Spin-wkts | Average | 5WI/ 10WM | Pace-wkts | Average | 5WI/ 10WM |
| West Indies | 79 | 24.02 | 7/ 0 | 64 | 34.43 | 0/ 0 |
| New Zealand | 127 | 27.14 | 8/ 2 | 59 | 34.05 | 1/ 0 |
| Australia | 210 | 29.05 | 15/ 4 | 82 | 36.57 | 2/ 0 |
| Zimbabwe | 43 | 31.27 | 2/ 0 | 27 | 37.29 | 1/ 0 |
| Pakistan | 91 | 31.50 | 6/ 2 | 67 | 35.16 | 5/ 1 |
| Sri Lanka | 73 | 31.82 | 3/ 2 | 48 | 36.08 | 2/ 0 |
| South Africa | 118 | 32.61 | 5/ 0 | 56 | 40.39 | 2/ 0 |
| England | 120 | 34.84 | 7/ 1 | 64 | 32.79 | 0/ 0 |
| Batsman | Runs | Balls | Dismissals | Average | Run rate |
| Michael Clarke | 132 | 308 | 3 | 44.00 | 2.57 |
| Shane Watson | 93 | 273 | 3 | 31.00 | 2.04 |
While Australia's batsmen have struggled against Indian spin, the visitors' spinners haven't made much of an impression on the Indian batsmen, either in terms of taking wickets or in terms of keeping the runs in check. The Australian spinners have conceded almost 42 runs per wicket, at an economy rate of 3.50 runs per over. Thus, the onus of taking wickets and keeping a check on the runs has fallen on the fast bowlers, and they've done a reasonably good job of it. Among the bowlers in the current Australian squad, though, only Mitchell Johnson has played more than one Test, and his six matches have fetched him 21 wickets at 37.23.
| Wickets | Average | Econ rate | Strike rate | 5WI/ 10WM | |
| Pace | 157 | 33.78 | 2.86 | 70.8 | 3/ 0 |
| Spin | 90 | 41.73 | 3.50 | 71.4 | 3/ 1 |
Among the Indian batting lot, the pressure will be on Sachin Tendulkar and Virender Sehwag, both of whom have had poor spells of late. Tendulkar scored a commanding century in the Irani Cup and has an outstanding record against Australia both home and away, while Virender Sehwag has better stats in Australia than in India. The biggest contrast in numbers, though, is for MS Dhoni, whose home average against Australia is more than twice his away average against them.
| Batsman | Home Tests | Average | 100s/ 50s | Away Tests | Average | 100s/ 50s |
| Sachin Tendulkar | 15 | 62.65 | 5/ 8 | 15 | 55.42 | 4/ 7 |
| Virender Sehwag | 10 | 40.15 | 1/ 5 | 10 | 47.40 | 2/ 4 |
| MS Dhoni | 6 | 44.12 | 0/ 4 | 7 | 18.69 | 0/ 1 |
| Murali Vijay | 2 | 62.50 | 1/ 0 | - | - | - |
All four venues hosting the Tests - Chennai, Hyderabad, Mohali and Delhi - have been pretty good ones for India: collectively they've lost only 13 out of 73 Tests at these grounds. Since 2000 they haven't lost at any of these venues, winning 13 out of 21 Tests, and drawing eight; they've won five out of six in Delhi, four out of seven in Mohali and three out of six in Chennai. Australia, on the other hand, haven't played a Test yet in Hyderabad, but have a losing record at the other three grounds, winning only two Tests out of 14, and losing six.
S Rajesh is stats editor of ESPNcricinfo. Follow him on Twitter