Way ahead of the pack
Sachin Tendulkar achieved the kind of batting numbers which are likely to remain records by some distance
S Rajesh
23-Dec-2012
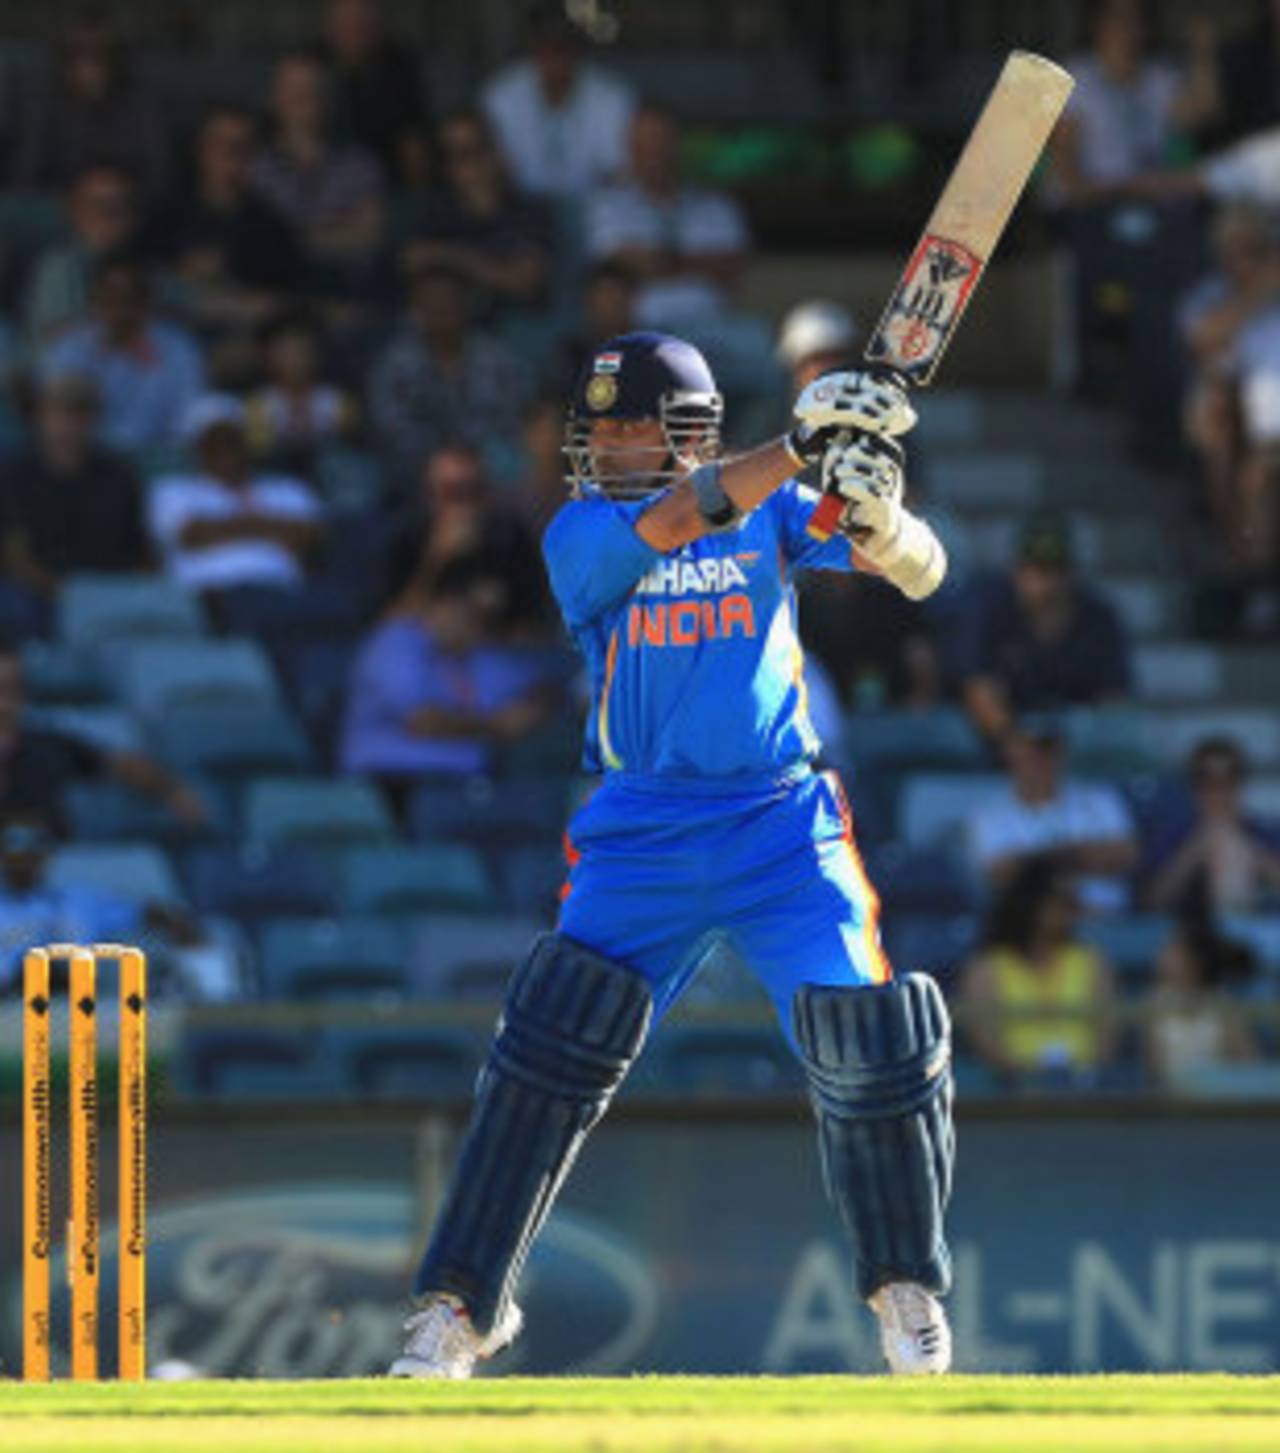
Let alone equalling or surpassing some of his records, it's possible that no batsman will even come close to his stats • Getty Images
Sachin Tendulkar's numbers are staggering in both forms of the game, but the margin by which he is ahead of the pack in ODIs is truly mindboggling. Let alone equalling or surpassing some of his records, it's possible that no batsman will even come close to his stats. To start with, Tendulkar's overall ODI aggregate is 18,426, which is almost 35% more than the next-best, Ricky Ponting's 13,704. His 49 ODI centuries is 63% better than the second-highest, Ponting's 30. With Sourav Ganguly, he added 8227 partnership runs, 50% more than Marvan Atapattu and Sanath Jayasuriya's 5462. His 26 century stands with Ganguly is 62.5% better than the 16 that Matthew Hayden and Adam Gilchrist managed. (There are several others - biggest partnership, most matches, most Man-of-the-Match awards, for example - which are available with a few clicks on ESPNcricinfo's record pages.)
Tendulkar was able to create such a distance between him and the next-best by, obviously, playing over a long period - his is the longest career in ODI history - but also by doing so at a ridiculously high standard almost throughout that period. It helped also, that he opened the innings through most of his career as an ODI batsman, which gave him the best opportunity to score runs and rack up hundreds. His outstanding batsmanship, which combined tight defence with an ability to score freely all round the wicket with minimal risk against different bowling attacks in different conditions, ensured he maximised those opportunities to score runs. Along the way he also became the first batsman to score 200 in an ODI innings.
Tendulkar's ODI career changed when he moved from the middle order to open the innings. The first time he did so was in his fifth match of 1994, against New Zealand in Auckland. He scored 82 off 49 balls - a strike rate of 167.34 - in a match in which no other batsman who faced more than 12 balls managed a rate of 75. India won the match with 160 balls to spare - their eighth-largest victory margin in terms of balls remaining - and it was clear that India had unearthed an option which could be of immense value to them in limited-overs cricket. None could have imagined at the time, though, that Tendulkar would end with such staggering numbers.
From the moment he started opening, his ODI career graph swung upwards and stayed high almost throughout his career. From March 27, 1994, which was the first time he opened, he averaged 47.08 in 394 matches, at a strike rate of 87.71. During this period he didn't open the batting in 50 matches, and in those games his average fell to 36.70.
| Period | ODIs | Runs | Average | Strike rate | 100s/ 50s |
| Before 1994 | 65 | 1679 | 31.09 | 74.32 | 0/ 12 |
| 1994 to Dec 2000 | 198 | 8220 | 45.66 | 88.96 | 27/ 38 |
| Jan 2001 onwards | 200 | 8527 | 48.17 | 86.41 | 22/ 46 |
| Career | 463 | 18,426 | 44.83 | 86.23 | 49/ 96 |
The opening act
Among all openers who scored 8000-plus ODI runs, Tendulkar's average is the highest; in fact, even with a 6000-run cut-off, no opener has an average of more than 42 - Gary Kirsten's 41.80 is the second-best. Apart from the high average and strike rate, the other stat that stands out for Tendulkar is his conversion rate of fifties into hundreds: he has 45 centuries and 75 half-centuries, a fifties to hundreds ratio of 1.67. Among openers with at least 6000 runs, the only ones with comparable ratios were Herschelle Gibbs (18 centuries and 24 fifties, ratio 1.33) and Saeed Anwar (20 hundreds and 37 fifties, ratio 1.85). All the others had ratios of more than two, with some of the top names (Haynes, Ganguly, Gilchrist) scoring three fifties per century. Thus, while it's true that Tendulkar was given the opportunity to make big scores thanks to his batting position, he also utilised that much better than most other openers.
Among all openers who scored 8000-plus ODI runs, Tendulkar's average is the highest; in fact, even with a 6000-run cut-off, no opener has an average of more than 42 - Gary Kirsten's 41.80 is the second-best. Apart from the high average and strike rate, the other stat that stands out for Tendulkar is his conversion rate of fifties into hundreds: he has 45 centuries and 75 half-centuries, a fifties to hundreds ratio of 1.67. Among openers with at least 6000 runs, the only ones with comparable ratios were Herschelle Gibbs (18 centuries and 24 fifties, ratio 1.33) and Saeed Anwar (20 hundreds and 37 fifties, ratio 1.85). All the others had ratios of more than two, with some of the top names (Haynes, Ganguly, Gilchrist) scoring three fifties per century. Thus, while it's true that Tendulkar was given the opportunity to make big scores thanks to his batting position, he also utilised that much better than most other openers.
| Batsman | Innings | Runs | Average | Strike rate | 100s/ 50s |
| Sachin Tendulkar | 340 | 15,310 | 48.29 | 88.05 | 45/ 75 |
| Sanath Jayasuriya | 383 | 12,740 | 34.61 | 92.48 | 28/ 66 |
| Adam Gilchrist | 259 | 9200 | 36.50 | 98.02 | 16/ 53 |
| Sourav Ganguly | 236 | 9146 | 41.57 | 73.59 | 19/ 58 |
| Desmond Haynes | 237 | 8648 | 41.37 | 63.09 | 17/ 57 |
| Chris Gayle | 217 | 8184 | 40.71 | 84.83 | 20/ 44 |
| Saeed Anwar | 220 | 8156 | 39.98 | 79.93 | 20/ 37 |
Australia's tormentor
Tendulkar was often at his best against the best team of his generation, Australia. He scored 3077 runs against them at 44.59, which is 36% more than the second-best aggregate against them. The highlights were obviously the 143 and 134 in Sharjah in 1998, a year which was his best in ODIs: he scored 1894 runs at 65.31, including nine centuries. Both, the runs scored and the hundreds remain a record for a calendar year.
Tendulkar was often at his best against the best team of his generation, Australia. He scored 3077 runs against them at 44.59, which is 36% more than the second-best aggregate against them. The highlights were obviously the 143 and 134 in Sharjah in 1998, a year which was his best in ODIs: he scored 1894 runs at 65.31, including nine centuries. Both, the runs scored and the hundreds remain a record for a calendar year.
Even apart from those two Sharjah classics, he had seven hundreds against Australia, the last one being 175 - his highest against Australia - three years ago in Hyderabad. Tendulkar's nine hundreds is also record for a batsman against one opposition. (Tendulkar also has eight hundreds against Sri Lanka, while no other batsman has more than seven against an opposition.)
The one glitch in Tendulkar's stats, though, are his ODI numbers in Australia: just one century in 46 innings, and a below-par average of 34.67. Unlike in Tests, where he averages more than 50 against Australia both home and away, in ODIs Tendulkar's best against them came in the subcontinent: in Asia he average 55.30 against them in 40 innings, with eight centuries, but outside Asia he averaged 29.82 against them, with one century in 30 innings.
| Batsman | ODIs | Runs | Average | Strike rate | 100s/ 50s |
| Sachin Tendulkar | 71 | 3077 | 44.59 | 84.74 | 9/ 15 |
| Desmond Haynes | 64 | 2262 | 40.39 | 65.14 | 6/ 13 |
| Viv Richards | 54 | 2187 | 50.86 | 84.63 | 3/ 20 |
| Brian Lara | 51 | 1858 | 39.53 | 76.58 | 3/ 15 |
| Kumar Sangakkara | 44 | 1706 | 42.65 | 77.02 | 1/ 12 |
| Jacques Kallis | 50 | 1660 | 34.58 | 72.87 | 1/ 13 |
| Jonty Rhodes | 55 | 1610 | 40.25 | 77.92 | 0/ 10 |
| Richie Richardson | 51 | 1498 | 32.56 | 63.26 | 0/ 15 |
World Cup superstar
In the biggest tournament in the format, Tendulkar was usually at his best. His overall World Cup tally of 2278 is the best, and he is also the only batsman to twice aggregate more than 500 in a World Cup tournament - he scored 673 in 2003, a record for a single World Cup, and 523 in 1996. Only four other batsmen have touched 500 even once in a World Cup. Tendulkar's nine Man-of-the-Match awards is also a World Cup record, three clear of the second-placed Glenn McGrath.
In the biggest tournament in the format, Tendulkar was usually at his best. His overall World Cup tally of 2278 is the best, and he is also the only batsman to twice aggregate more than 500 in a World Cup tournament - he scored 673 in 2003, a record for a single World Cup, and 523 in 1996. Only four other batsmen have touched 500 even once in a World Cup. Tendulkar's nine Man-of-the-Match awards is also a World Cup record, three clear of the second-placed Glenn McGrath.
Apart from his World Cup heroics, Tendulkar also finished with a great record in tournament finals, though there was a period between 1999 and 2004 when he appeared to struggle in them. Overall he averaged more than 54 in tournament finals, with six hundreds in 39 innings.
| Batsman | Innings | Runs | Average | Strike rate | 100s/ 50s |
| Viv Richards | 21 | 1013 | 63.31 | 85.05 | 3/ 5 |
| Sachin Tendulkar | 44 | 2278 | 56.95 | 88.98 | 6/ 15 |
| Herschelle Gibbs | 23 | 1067 | 56.15 | 87.38 | 2/ 8 |
| Sourav Ganguly | 21 | 1006 | 55.88 | 77.50 | 4/ 3 |
| Mark Waugh | 22 | 1004 | 52.84 | 83.73 | 4/ 4 |
| Jacques Kallis | 32 | 1148 | 45.92 | 74.40 | 1/ 9 |
| Ricky Ponting | 42 | 1743 | 45.86 | 79.95 | 5/ 6 |
| Javed Miandad | 30 | 1083 | 43.32 | 68.02 | 1/ 8 |
| Brian Lara | 33 | 1225 | 42.24 | 86.26 | 2/ 7 |
The matchwinner
It was often said about Tendulkar that his big scores didn't lead to team wins, but stats reveal something quite different: Tendulkar scored 33 of his 49 centuries in wins, and averaged more than 56 in team wins, at a strike rate of 90. Among those who scored at least 5000 runs in wins, only Lara and Richards have higher averages. In terms of hundreds scored in wins, Ponting is next with 25.
It was often said about Tendulkar that his big scores didn't lead to team wins, but stats reveal something quite different: Tendulkar scored 33 of his 49 centuries in wins, and averaged more than 56 in team wins, at a strike rate of 90. Among those who scored at least 5000 runs in wins, only Lara and Richards have higher averages. In terms of hundreds scored in wins, Ponting is next with 25.
However, it's also true that Tendulkar's 14 centuries in defeats is a record too, five clear of Chris Gayle, who's next with nine. In defeats, though, Tendulkar's average dropped to 33.25 at a strike rate of 79.86. Clearly, in the overall context of his lengthy career, his runs led to wins more often that not. As mentioned earlier, no player has won as many Man-of-the-Match awards either - Tendulkar has 62, while the next-best is Jayasuriya with 48.
| Batsman | Innings | Runs | Average | Strike rate | 100s/ 50s |
| Brian Lara | 134 | 6553 | 61.82 | 86.32 | 16/ 42 |
| Viv Richards | 114 | 5129 | 56.98 | 93.01 | 11/ 32 |
| Sachin Tendulkar | 231 | 11,157 | 56.63 | 90.31 | 33/ 59 |
| Mohammad Yousuf | 151 | 6426 | 55.87 | 78.59 | 14/ 41 |
| Sourav Ganguly | 147 | 6938 | 55.06 | 77.87 | 18/ 41 |
| Michael Clarke | 134 | 5084 | 52.95 | 80.62 | 4/ 42 |
Partnerships, and percentage of team runs scored
With Ganguly, Tendulkar added 8227 partnership runs at 47.55, with 26 century stands - the runs scored and the hundred stands are the highest. Tendulkar also put together 4000-plus runs with Virender Sehwag (4387 runs at 39.16) and Rahul Dravid (4117 runs at 44.26). Tendulkar's thus the only batsman to put together 4000-plus runs with three different partners; Ganguly and Dravid are the only others to do so with two different partners.
With Ganguly, Tendulkar added 8227 partnership runs at 47.55, with 26 century stands - the runs scored and the hundred stands are the highest. Tendulkar also put together 4000-plus runs with Virender Sehwag (4387 runs at 39.16) and Rahul Dravid (4117 runs at 44.26). Tendulkar's thus the only batsman to put together 4000-plus runs with three different partners; Ganguly and Dravid are the only others to do so with two different partners.
Overall, Tendulkar scored 19.24% of the total bat runs that India scored in the matches he played in his entire ODI career (18,426 runs out of 95,765). After he first opened the batting on March 27, 1994, the percentage increased to 20.08 (16,668 out of 83,008). For Ganguly, that percentage was 17.61%, for Haynes 19.58, for Anwar 18.19, for Hayden 17.49 and for Gayle 18.41%.
Apart from his obvious batting exploits, there was also Tendulkar the bowler, who chipped in quite usefully more than once. His 154 ODI wickets puts him in 11th place among Indian bowlers, just one short of Ashish Nehra and three away from Manoj Prabhakar.
S Rajesh is stats editor of ESPNcricinfo. Follow him on Twitter