The Sri Lankan challenge
South Africa have a superb overseas record in the last few years, but in Sri Lanka their batsmen and spinners have struggled
S Rajesh
04-Jul-2014
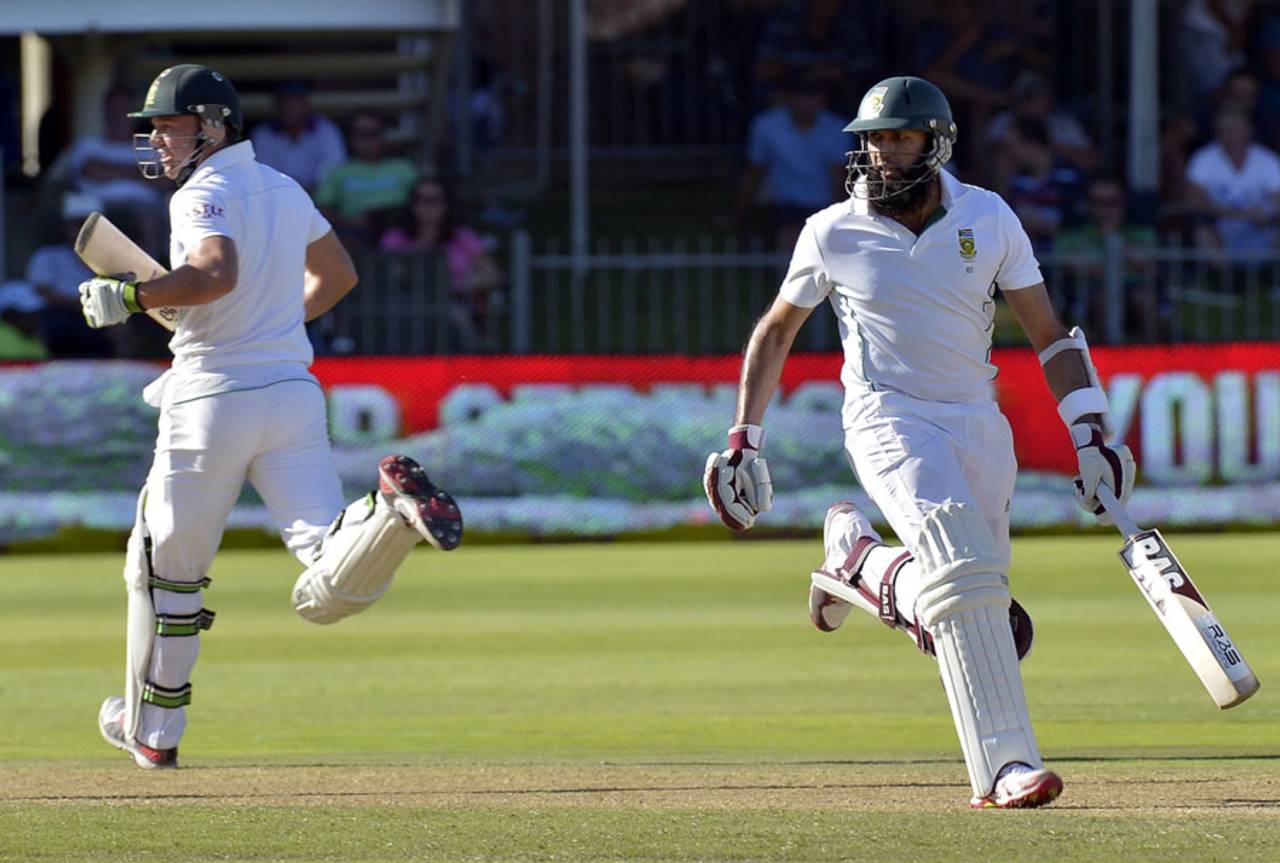
Hashim Amla and AB de Villiers have been superb in other parts of Asia, but they'll have to turn on the run-tap in Sri Lanka over the next four weeks • AFP
One of the key strengths of the South African team over the last several years has been their ability to play well and win away from home. Since the beginning of 2007, they've played 12 Test series overseas and haven't lost a single one, winning eight and drawing four. (The drawn ones have all been in India and the UAE.) No team has been anywhere near as impressive in overseas Tests during this period: South Africa's win-loss record is 16-5, while the next best is Australia's 14-17. During this period, South Africa have won Test series twice each in England and Australia, and once each in Pakistan, New Zealand, West Indies and Bangladesh.
One prominent country missing from the list is Sri Lanka: South Africa last toured there for a Test series in July 2006 - eight years ago - losing 2-0; it was also their last away series defeat in Tests. Before that, they had played a two-Test series there in 2004, losing 1-0. They recently played a bilateral ODI series there last year, losing 4-1; before that, they had played a bilateral ODI series in Sri Lanka in 2004 - the result then was 0-5.
These results indicate why the next month is so crucial for South Africa. They have Hashim Amla as their new captain in Tests, while AB de Villiers, their leader in ODIs, oversaw the 1-4 defeat a year ago; the priority for both will be to redress South Africa's skewed record in both forms of the game in Sri Lanka.
Since 2000, South Africa's win-loss ratios in Tests and ODIs are much worse in Sri Lanka than in any other country. Overall during this period, they've won almost two matches per defeat in both formats - the ratio is 1.87 in Tests, and 1.76 in ODIs. Yet, in Sri Lanka they've been abysmal, with a 0.25 win-loss ratio in Tests, and 0.38 in ODIs.
Their Sri Lankan record is all the more surprising because they've generally done well in other countries in Asia. South Africa have had plenty of success in India, winning four out of nine Tests, and have also done well in Pakistan and the UAE. In Asian countries other than Sri Lanka, they have a 10-5 record in Tests (6-5 excluding Bangladesh) and 34-21 in ODIs (27-19 excluding Bangladesh). Yet, the Sri Lankan puzzle is something they've been unable to solve.
| Tests | ODIs | |||||
| Host country | Matches | W/ L | Ratio | Matches | W/ L | Ratio |
| Bangladesh | 4 | 4/ 0 | - | 10 | 7/ 2 | 3.50 |
| West Indies | 12 | 6/ 1 | 6.00 | 27 | 21/ 6 | 3.50 |
| South Africa | 74 | 44/ 19 | 2.31 | 147 | 100/ 38 | 2.63 |
| England | 12 | 6/ 3 | 2.00 | 23 | 8/ 12 | 0.66 |
| New Zealand | 6 | 2/ 1 | 2.00 | 9 | 4/ 5 | 0.80 |
| India | 9 | 4/ 3 | 1.33 | 21 | 11/ 10 | 1.10 |
| Pakistan | 4 | 1/ 1 | 1.00 | 10 | 6/ 4 | 1.50 |
| UAE | 4 | 1/ 1 | 1.00 | 15 | 10/ 5 | 2.00 |
| Australia | 12 | 3/ 6 | 0.50 | 26 | 14/ 11 | 1.27 |
| Sri Lanka | 7 | 1/ 4 | 0.25 | 18 | 5/ 13 | 0.38 |
| Total | 146 | 73/ 39 | 1.87 | 327 | 200/ 113 | 1.76 |
In ODIs, South Africa's numbers in Sri Lanka would look even worse if not for their matches against other teams in that country: South Africa have a 4-1 record here against other teams, having beaten Pakistan twice, and West Indies and Kenya once each. Their only defeat was a horrible choke against India in the semi-finals of the Champions Trophy in 2002, when they were 194 for 1 after 38 overs, chasing 262, and still managed to lose by ten runs.
Against Sri Lanka in Sri Lanka, though, South Africa's record is quite embarrassing - one win, 12 defeats. It's quite clearly their worst record in any country in ODIs. They've lost quite a few in England too, but many of those defeats came after they had won gruelling Test series' there. In Sri Lanka, there have been no such excuses. Not only have there been losses, but the margins have been embarrassing as well: on the last tour, South Africa lost three of the matches by 180 runs, 128 runs, and eight wickets. In fact, there is no difference between the records for South Africa and Bangladesh, in ODIs against Sri Lanka in Sri Lanka since 2000.
The averages indicate they have been let down by both their batsmen and their bowlers in Sri Lanka, but the batsmen have probably done worse. When playing in India, Pakistan or the UAE, the South African batsmen average 35.11, at a run rate of 5.04 per over; with the ball, they average 26.12, and concede 4.81 runs per over. In Sri Lanka, the batting has been woeful, with an average of under 23 and a scoring rate of 4.49; the bowlers have been poor too, averaging 40.26 at an economy rate of 5.24.
| Tests | ODIs | |||||
| Matches | W/ L | Ratio | Matches | W/ L | Ratio | |
| in Asia (excl SL) | 21 | 10/ 5 | 2.00 | 56 | 34/ 21 | 1.61 |
| in Sri Lanka | 7 | 1/ 4 | 0.25 | 18 | 5/ 13 | 0.38 |
| Versus | Matches | W/ L | Ratio | Bat ave | Run rate | Bowl ave | Econ rate |
| Bangladesh | 6 | 6/ 0 | - | 58.47 | 4.99 | 15.85 | 3.57 |
| Zimbabwe | 6 | 6/ 0 | - | 53.56 | 5.80 | 28.13 | 4.36 |
| West Indies | 18 | 16/ 2 | 8.00 | 45.36 | 5.18 | 25.21 | 4.62 |
| Pakistan | 10 | 6/ 4 | 1.50 | 34.81 | 4.85 | 27.72 | 4.71 |
| Australia | 16 | 7/ 8 | 0.87 | 32.46 | 4.70 | 31.00 | 5.13 |
| India | 13 | 6/ 7 | 0.85 | 41.39 | 5.45 | 36.29 | 5.58 |
| New Zealand | 9 | 4/ 5 | 0.80 | 37.79 | 5.18 | 32.34 | 5.10 |
| England | 15 | 3/ 10 | 0.30 | 25.46 | 4.67 | 39.28 | 5.15 |
| Sri Lanka | 13 | 1/ 12 | 0.08 | 22.65 | 4.49 | 40.26 | 5.24 |
The numbers for individual batsmen further underscore how some of them have struggled badly in Sri Lanka. JP Duminy has scored 194 from ten innings, which is a far cry from his stats in other parts of Asia; ditto for Herschelle Gibbs as well. Faf du Plessis had a horror series in 2013, and needs to make amends. AB de Villiers got starts but had a highest of only 51 in five innings, which is less than he has averaged in other parts of Asia.
| v Sri Lanka in Sri Lanka | in Ind, Pak, UAE | |||||
| Batsman | Matches | Average | SR | Matches | Average | SR |
| Jacques Kallis | 8 | 47.85 | 63.20 | 38 | 45.82 | 72.36 |
| JP Duminy | 10 | 19.40 | 70.80 | 18 | 43.76 | 86.06 |
| Graeme Smith | 5 | 27.80 | 68.81 | 27 | 36.38 | 76.35 |
| AB de Villiers | 5 | 27.40 | 81.54 | 27 | 59.76 | 94.00 |
| David Miller | 5 | 40.66 | 91.72 | 9 | 14.25 | 71.69 |
| Herschelle Gibbs | 5 | 17.80 | 59.73 | 25 | 38.50 | 84.95 |
| Hashim Amla | 2 | 47.50 | 95.95 | 15 | 51.35 | 95.86 |
| Faf du Plessis | 5 | 11.40 | 51.35 | 10 | 29.42 | 63.58 |
The lack of spin options in the current South African squad is a concern for many, and it has been a handicap on previous tours as well. Though they haven't done too badly on the economy front, South Africa's spinners have hardly been wicket-taking options in ODIs against Sri Lanka in Sri Lanka, taking only 15 wickets at an average of 63.80; in these same 13 matches, Sri Lanka's spinners have taken 73 South African wickets, at an average of 22.43, and an economy rate of 4.17.
| v Sri Lanka in Sri Lanka | in Ind, Pak, UAE | |||||
| Wickets | Average | Econ rate | Wickets | Average | Econ rate | |
| Pace | 55 | 38.74 | 5.14 | 276 | 27.05 | 4.65 |
| Spin | 15 | 63.80 | 4.97 | 75 | 34.34 | 4.86 |
In Tests too, South Africa have had too many batsmen and bowlers struggling to make an impact. A team that has averaged 39.36 with the bat and 35.07 with the ball in away Tests since 2000, has averaged 28.28 with the bat and 42.19 with the ball in Sri Lanka.
With the bat, only one batsman - de Villiers - has averaged more than 40. Even the usually prolific Kallis averaged only 35.33 in Tests in Sri Lanka, compared to 64.64 in India, Pakistan and the UAE. In matches in the past, Gary Kirsten, Neil McKenzie and Amla have averaged more than 50 in other parts of Asia, but less than 25 in Sri Lanka. Amla has played only two Tests in Sri Lanka, but as captain of the ship this time, he has an opportunity to rectify the numbers for himself and his team.
As in ODIs, South Africa's spinners have struggled to make an impact in Sri Lanka in Tests as well, conceding 50 runs per wicket. The quick bowlers have done a bit better, but not as well as they have in other parts of Asia: Dale Steyn has 49 wickets from 11 Tests in India, Pakistan and the UAE, at an average of 24.63 and a strike rate of 43.7, but in two Tests in Sri Lanka he has averaged 36.50. However, compared to the fast bowlers, it's the South African spinners who have struggled more in Sri Lanka, against batsmen who are particularly adept at playing spin bowling. Clearly, Imran Tahir (in Tests and ODIs), Aaron Phangiso (ODIs) and Dane Piedt (Tests), the spin specialists for South Africa, will have their work cut out over the next four weeks.
| v Sri Lanka in Sri Lanka | in Ind, Pak, UAE | |||||
| Matches | Average | 100s/ 50s | Matches | Average | 100s/ 50s | |
| Mark Boucher | 7 | 30.33 | 0/ 4 | 12 | 28.64 | 0/ 3 |
| Jacques Kallis | 5 | 35.33 | 0/ 3 | 17 | 64.64 | 8/ 4 |
| AB de Villiers | 2 | 54.25 | 0/ 2 | 11 | 72.26 | 3/ 3 |
| Herschelle Gibbs | 3 | 22.16 | 0/ 1 | 6 | 36.54 | 0/ 3 |
| Gary Kirsten | 3 | 21.83 | 0/ 1 | 4 | 70.00 | 1/ 4 |
| Hashim Amla | 2 | 17.25 | 0/ 0 | 11 | 77.23 | 6/ 5 |
| Neil McKenzie | 3 | 9.00 | 0/ 0 | 5 | 52.12 | 1/ 1 |
| v Sri Lanka in Sri Lanka | in Ind, Pak, UAE | |||||
| Wickets | Average | Strike rate | Wickets | Average | Strike rate | |
| Pace | 67 | 38.07 | 70.8 | 168 | 31.93 | 65.6 |
| Spin | 31 | 50.29 | 89.4 | 75 | 39.14 | 80.4 |
S Rajesh is stats editor of ESPNcricinfo. Follow him on Twitter