A rough venue for England's batsmen
Stats preview to the first Ashes Test at Trent Bridge, a ground which has been pretty tough on batsmen over the last ten years
S Rajesh
09-Jul-2013
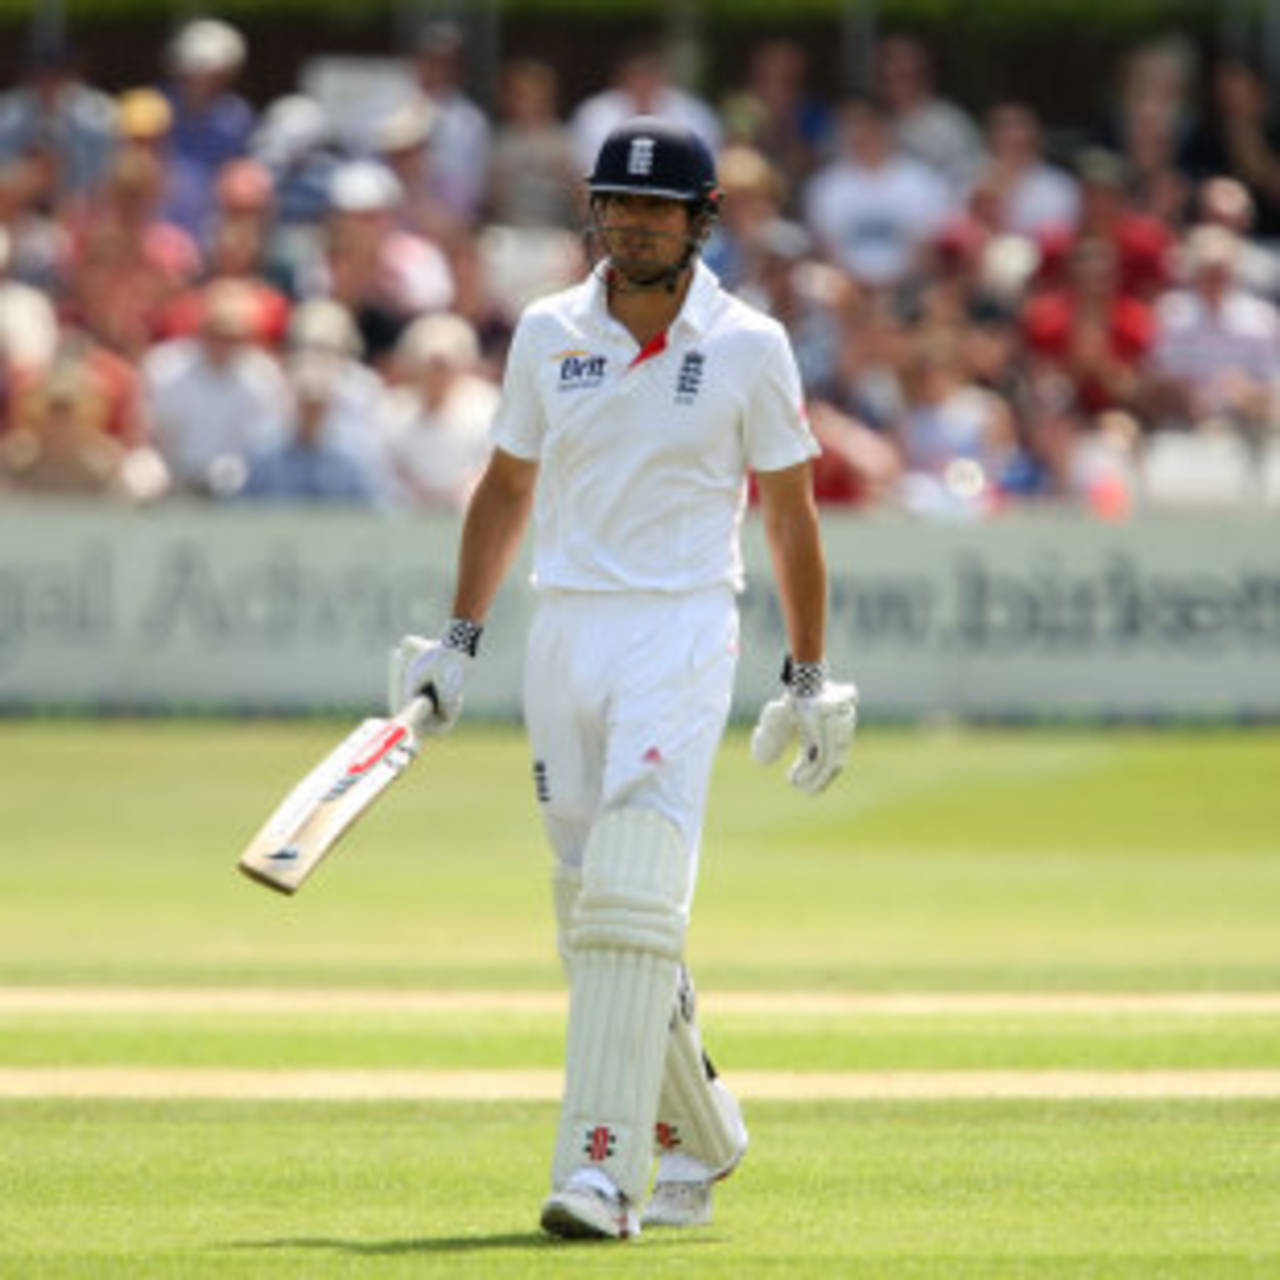
Alastair Cook has a highest of 43 not out in 11 Test innings at Trent Bridge, and an average of 19.50 • Getty Images
Expect a result
The last time a Test at Trent Bridge was drawn was in 2002, when India's power-packed top-order batted 115 overs in their second innings after facing a first-innings deficit of 260. Since then, nine Tests at the ground have all produced decisive results, with England triumphant in seven of those games. The two Tests they lost during this period were both against subcontinent sides: Sri Lanka beat them by 134 runs in 2006, while India snatched a seven-wicket win the following year. Since then, England have won four on the trot, against New Zealand, Pakistan, India and West Indies. (Click here for all results at Trent Bridge since the beginning of 2000.)
As mentioned earlier, no Test has been drawn at Trent Bridge for the last ten years. Since the beginning of 2003, only three other venues have hosted six or more Tests without a single draw - MCG, Wanderers (ten all-result Tests) and Sabina Park (nine all-result Tests).
Tough for batsmen
In these nine Tests at Trent Bridge, the batting average (excluding extras) has been 26.84 runs per wicket. With a six Test cut-off, the only venue with a lower average is Sabina Park, with an average of 24.15. There have been 15 hundreds in these nine Tests - ten of them by England's batsmen, who've averaged 30.37 per wicket, compared to five hundreds and an average of 23.72 by overseas batsmen.
Australia's bowlers will also be happy to see that none of the England batsmen in the current squad average 40 at Trent Bridge. Kevin Pietersen has the best average, of 38.75, but even that's well below his overall Test average in England. Ian Bell has had his problems too: in his first six Test innings here he had scores of 3,3,31,0,0,31, before his 159 against India in 2011 lifted his average into the 30s, which is still much lower than overall average in England.
The two big disappointments in Trent Bridge, though, have been Alastair Cook and Jonathan Trott. In 11 innings, Cook has a highest score of 43 not out here, against West Indies last year, while Trott hasn't gone past 38 in six attempts; together they've scored 317 runs in 17 innings at Trent Bridge, at an average of 21.13, with no half-century.
| Batsman | Tests | Runs | Average | 100s/ 50s | Ave in Eng |
| Kevin Pietersen | 7 | 465 | 38.75 | 1/ 2 | 54.59 |
| Stuart Broad | 4 | 224 | 37.33 | 0/ 2 | 33.33 |
| Matt Prior | 4 | 216 | 36.00 | 1/ 1 | 42.27 |
| Ian Bell | 5 | 249 | 31.12 | 1/ 0 | 52.39 |
| Jonathan Trott | 3 | 122 | 24.40 | 0/ 0 | 56.45 |
| Alastair Cook | 6 | 195 | 19.50 | 0/ 0 | 45.31 |
Perfect for pace
England's batsmen have all struggled here, but their current lot of fast bowlers all have outstanding records at this venue. James Anderson leads in terms of wickets, with 39 from six Tests at an average of less than 18. His best figures in an innings and in a match have both come at this ground: against New Zealand in 2008 he took 7 for 43, which remain his best in an innings, while his match haul of 11 for 71 against Pakistan in 2010 is the only time he's taken ten in a Test match. In fact, four of his 13 five-fors have been at this ground.
Stuart Broad has also done well here, though only one of his eight five-fors in Tests has been at Trent Bridge. Tim Bresnan has played only two Tests in Nottingham, but he made telling contributions in both, taking seven wickets against India in 2011 and eight against West Indies the following year.
The one bowler who hasn't enjoyed bowling here is Graeme Swann - in three Tests he has three wickets at an average of 65, and an economy rate of 4.50 runs per over. To be fair to him, though, Swann hasn't bowled much here, because the fast bowlers have done all the damage: in three matches he has only bowled 43.2 overs.
| Bowler | Tests | Wickets | Average | Strike rate | 5WI/ 10WM |
| James Anderson | 6 | 39 | 17.74 | 38.1 | 4/ 1 |
| Stuart Broad | 4 | 18 | 21.33 | 44.9 | 1/ 0 |
| Tim Bresnan | 2 | 15 | 15.80 | 30.8 | 1/ 0 |
| Steven Finn | 1 | 5 | 15.60 | 22.8 | 0/ 0 |
| Graeme Swann | 3 | 3 | 65.00 | 86.6 | 0/ 0 |
Over the last ten years, fast bowlers have done better than spinners here, but the difference in averages is far more pronounced for England than for the overseas bowlers.
| Overall | Engand's bowlers | |||||
| Wickets | Average | Strike rate | Wickets | Average | Strike rate | |
| Pace | 259 | 27.37 | 53.3 | 151 | 23.31 | 47.5 |
| Spin | 60 | 31.81 | 60.5 | 20 | 34.10 | 68.5 |
The head-to-head contests
Michael Clarke and Shane Watson will probably be two key batsmen for Australia, so here's a look at how they've fared against England's current bowlers.
The stat that stands out in Clarke's table is the amount of success Anderson has had against him: six dismissals in 255 balls, conceding 153 runs, for an average 25.50. Most of his success against Clarke has come in Australia, though - four dismissals conceding 60 runs. However, with a Dukes ball in hand and in conditions expected to favour swing, Anderson will fancy his chances of continuing his domination over Clarke - two more dismissals will make Anderson the most successful Test bowler against Clarke; Ishant Sharma and Dale Steyn are currently leaders, having dismissed him seven times. Clarke, though, has pretty good records against Broad and Swann.
Watson, on the other hand, has a superb record against Anderson, which should be encouraging for Australia given that he will open the batting.
| Overall | In England | |||||
| Bowler | Runs/ Balls | Dismissals | Average | Runs/ Balls | Dismissals | Average |
| James Anderson | 153/ 255 | 6 | 25.50 | 93/ 114 | 2 | 46.50 |
| Graeme Swann | 138/ 304 | 2 | 69.00 | 83/ 153 | 1 | 83.00 |
| Stuart Broad | 89/ 187 | 2 | 44.50 | 66/ 158 | 2 | 33.00 |
| Graham Onions | 59/ 103 | 1 | 59.00 | 59/ 103 | 1 | 59.00 |
| Tim Bresnan | 32/ 68 | 1 | 32.00 | - | - | - |
| Steven Finn | 30/ 53 | 1 | 30.00 | - | - | - |
| Overall | In England | |||||
| Bowler | Runs/ Balls | Dismissals | Average | Runs/ balls | Dismissals | Average |
| James Anderson | 217/ 427 | 3 | 72.33 | 69/ 129 | 1 | 69.00 |
| Steven Finn | 93/ 134 | 2 | 46.50 | - | - | - |
| Graeme Swann | 87/ 210 | 0 | - | 35/ 71 | 0 | - |
| Stuart Broad | 63/ 161 | 2 | 31.50 | 21/ 55 | 2 | 10.50 |
| Graham Onions | 50/ 63 | 2 | 25.00 | 50/ 63 | 2 | 25.00 |
| Tim Bresnan | 24/ 81 | 2 | 12.00 | - | - | - |
Both Watson and Clarke haven't been bothered much by Swann, who has done much better against Australia's left-handers than right-handers - his average against Australia's right-handers is nearly 50. Against Australia's left-handers, though, Swann has had much more success, dismissing Marcus North five times (average 26), Simon Katich four times (average 18.75), and Michael Hussey four times (average 63.75). The good news for Swann is that Australia will have plenty of left-handers this time around too.
| Runs | Balls | Dismissals | Average | Strike rate | |
| Right-handers | 591 | 1169 | 12 | 49.25 | 97.42 |
| Left-handers | 573 | 1168 | 17 | 33.70 | 68.71 |
| Total | 1164 | 2337 | 29 | 40.13 | 80.58 |
Among Australia's current bowlers, Peter Siddle is the only one who has bowled more than 100 overs against England. His stats against England's top batmen is a mixed bag: he's had plenty of success against Pietersen and Prior, but his combined figures against Trott and Bell are 1 for 237 off 64.2 overs.
| Overall | In England | |||||
| Batsman | Runs/ Balls | Dismissals | Average | Runs/ Balls | Dismissals | Average |
| Alastair Cook | 143/ 345 | 4 | 35.75 | 49/ 103 | 2 | 24.50 |
| Ian Bell | 141/ 195 | 1 | 141.00 | 37/ 69 | 1 | 37.00 |
| Matt Prior | 109/ 147 | 5 | 21.80 | 75/ 96 | 2 | 37.50 |
| Jonathan Trott | 96/ 191 | 0 | - | 14/ 39 | 0 | - |
| Kevin Pietersen | 83/ 163 | 4 | 20.75 | 32/ 63 | 2 | 16.00 |
S Rajesh is stats editor of ESPNcricinfo. Follow him on Twitter