South Africa, England the teams to beat
England top the win-loss ratio and run rate charts since the 2015 World Cup; South Africa aren't too far behind on both counts either
S Rajesh
May 28, 2017, 4:15 PM
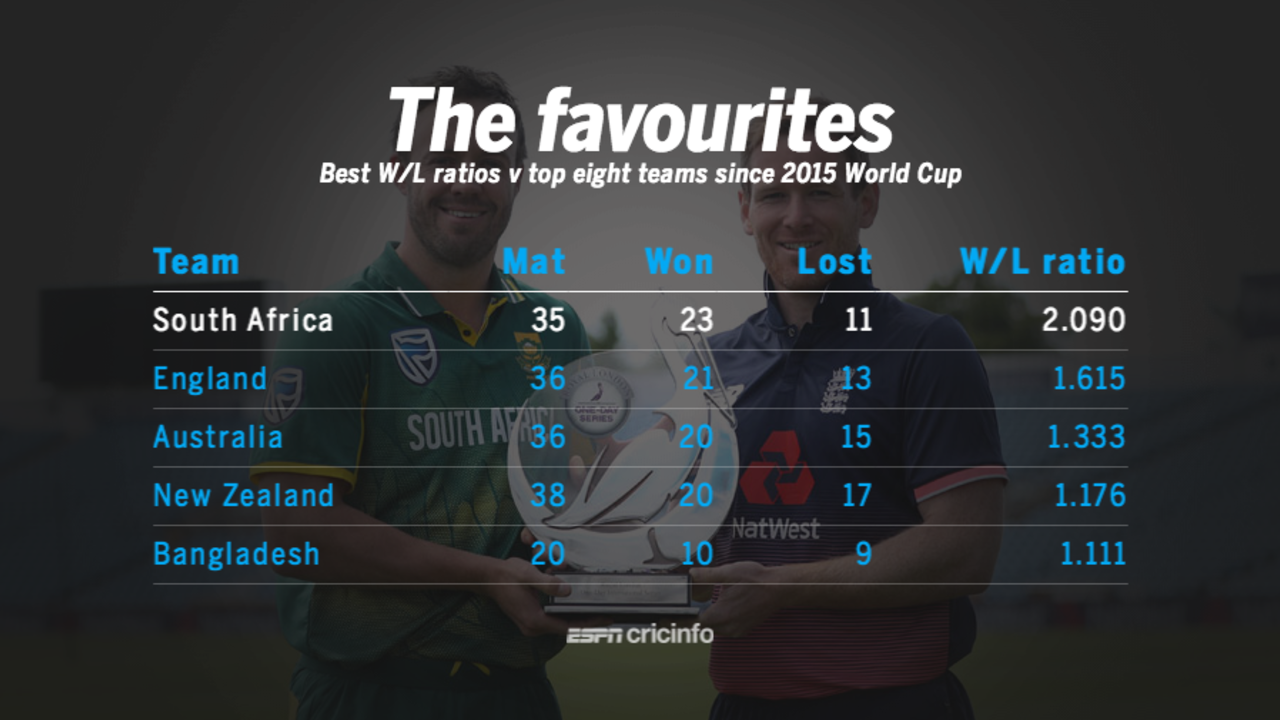
South Africa have the best win-loss ratio against the top teams since the 2015 World Cup • ESPNcricinfo Ltd
All stats are correct as of May 26, 2017.
26/13 England's win-loss record in ODIs since the 2015 World Cup; their ratio of 2.00 is the best among all teams during this period. South Africa are next at 25-13, followed by Bangladesh's 16-10. Against teams that are playing in the 2017 Champions Trophy, South Africa have a 23-11 record, which is the best, followed by England's 21-13.
10/9 Bangladesh's win-loss record against the top eight teams in ODIs since the 2015 World Cup, the best among the four Asian teams. India have won nine and lost 12, while Sri Lanka (5-19) and Pakistan (6-18) have the worst records against the top teams in this period.
6.14 The average ODI run rate in England since the 2015 World Cup. This is the highest among all countries that have hosted at least 10 ODIs since. Australia are next with a rate of 6.00, followed by South Africa (5.94) and India (5.74). In the period between 2013 and the end of the 2015 World Cup, the run rate in England was 5.21, sixth among ten countries.
6.28 England's ODI run rate since the 2015 World Cup; they are the only team to score at more than a run a ball during this period. South Africa are next at 5.82 followed by Australia's 5.81. Against the top eight teams England have done even better, scoring at 6.33 runs per over. In these two years, England have 20 scores of 300 or more. South Africa are next best with 12.
| Team | W/ L | Ratio | Bat ave | RR | Bowl ave | ER |
| South Africa | 23/ 11 | 2.09 | 40.17 | 5.85 | 31.13 | 5.57 |
| England | 21/ 13 | 1.62 | 41.11 | 6.33 | 36.30 | 5.86 |
| Australia | 20/ 15 | 1.33 | 35.93 | 5.86 | 32.36 | 5.64 |
| New Zealand | 20/ 17 | 1.18 | 32.84 | 5.66 | 32.67 | 5.72 |
| Bangladesh | 10/ 9 | 1.11 | 35.48 | 5.55 | 31.15 | 5.33 |
| India | 9/ 12 | 0.75 | 38.90 | 5.89 | 37.55 | 5.97 |
| Pakistan | 6/ 18 | 0.33 | 31.85 | 5.39 | 44.36 | 5.96 |
| Sri Lanka | 5/ 19 | 0.26 | 28.00 | 5.28 | 46.65 | 6.08 |
8/1 India's ODI win-loss record in England in the last five years, the best ratio among all teams during this period. Pakistan have the poorest record (1-7) among the teams participating in the Champions Trophy. Bangladesh, meanwhile, haven't played an ODI in England during this period; they last played in 2010 and have a 2-7 record since 2005.
6.02 England's run rate in the middle overs in ODIs since April 2015. They are the only team scoring at more than a run a ball in the middle overs as well in this period. The next highest is India's 5.47. England have hit a four or a six once every 10 balls, while the next best is 11, by Bangladesh. They are also the only team with a dot-ball percentage of less than 45 in the middle overs. The two highest run-scorers in the middle overs during this period are also from England: Eoin Morgan (1309 runs at a strike rate of 97), and Joe Root (1277 runs at a strike rate of 95).
| Batting Team | Run rate | Ave | BpB | Dot % |
| England | 6.02 | 49.00 | 10.00 | 44.67 |
| India | 5.47 | 53.85 | 11.66 | 46.58 |
| South Africa | 5.45 | 44.35 | 11.86 | 46.27 |
| Pakistan | 5.40 | 41.03 | 12.40 | 47.37 |
| Australia | 5.39 | 45.45 | 11.70 | 48.61 |
| Bangladesh | 5.29 | 39.57 | 11.01 | 51.50 |
| New Zealand | 5.22 | 37.01 | 11.82 | 50.19 |
| Sri Lanka | 5.06 | 35.13 | 13.40 | 49.97 |
31 ODI wickets for Mustafizur Rahman against the top eight teams since the 2015 World Cup. He's got them at an average of 18.41 and an economy rate of 4.84. While nine bowlers have taken more wickets than he has, in terms of the bowling factor - average multiplied by runs conceded per ball - Mustafizur has the best numbers, among bowlers with 25 or more wickets against the top eight teams.
42.67 The bowling average for legspinners in ODIs in England in the last five years. They have taken 42 wickets, at an economy rate of 6.16. Offspinners have done better, taking 147 wickets at an average of 34.31 and an economy rate of 5.12, while left-arm spinners average 33.85 at an economy rate of 4.95. England's Adil Rashid hasn't done badly at home, taking 37 wickets at 31.72 (ER 5.72), though his best bowling figures were achieved against the relatively weak Ireland batting line-up, when he took 5 for 27 in Bristol. In his only ODI in England, Imran Tahir had figures of none for 68 from nine, while Yasir Shah has figures of none for 110 from 15.3 overs.
| Bowler type | Wkts | Ave | ER | SR |
| Right-arm pace | 467 | 34.77 | 5.43 | 38.40 |
| Left-arm pace | 114 | 35.16 | 5.66 | 37.24 |
| Offspin | 147 | 34.31 | 5.12 | 40.19 |
| Left-arm orthodox | 62 | 33.85 | 4.95 | 41.05 |
| Legspin | 42 | 42.67 | 6.16 | 41.55 |
9 ODI hundreds for David Warner since April 2015, the most for any batsman. Quinton de Kock is next with six. Warner's aggregate of 1899 is also the highest during this period. Against the eight participating teams at the Champions Trophy, Warner's aggregate is the highest since the last World Cup, but in terms of the batting factor - the product of the average and the runs scored per ball - AB de Villiers is slightly ahead of Warner (among batsmen with 750 or more runs).
2 Instances of Australia winning the Champions Trophy - they are the only team with outright wins in two finals. India have also won twice, but in 2002 they shared the trophy with Sri Lanka after the final was washed out. South Africa, New Zealand and West Indies have won it once each.
15/6 India's win-loss record in the Champions Trophy, the best among all teams. Australia are next with a 12-7 record.
S Rajesh is stats editor of ESPNcricinfo. @rajeshstats