India's least favourite venue
India have lost the last four times they've turned up for a Test at the Basin Reserve, and some of their heaviest defeats against New Zealand have been at this ground
S Rajesh
Apr 1, 2009, 6:07 PM
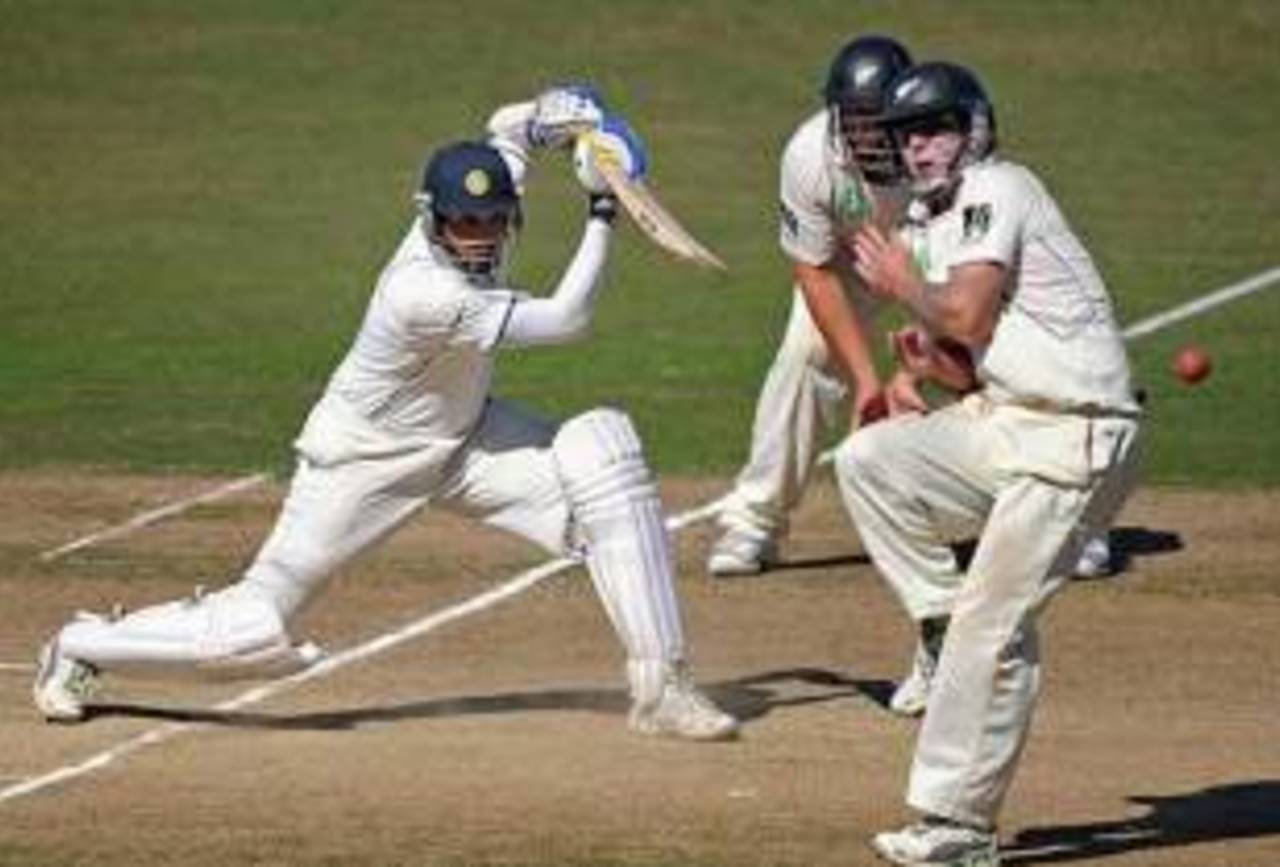
VVS Laxman has been in fine form in this series, but he hasn't scored a run in his two previous innings at the Basin Reserve • AFP
After India's dogged fightback in Napier, they will go into the Wellington Test as favourites to wrap up the series, but if past stats are any indicator, New Zealand will fancy their chances of turning the tables on India despite spending three days in the field in the previous Test without a positive result. More than New Zealand's good record here, the home team will be encouraged by India's struggles at this venue.
New Zealand have themselves lost about as often as they've won here, but India have lost the last four times they've turned up for a Test at the Basin Reserve. (They've only lost to New Zealand nine times in all, which means almost 50% of their defeats have come at a single venue.) Some of their heaviest defeats against New Zealand have come here too - their innings-and-33-run loss in 1976 is their only innings defeat against them, while they also lost by ten wickets the last time they played a Test at this ground. Their innings-by-innings list doesn't make impressive reading either, with seven scores of less than 225 in ten innings.
| Team and period | Played | Won | Lost | Drawn |
| New Zealand - overall | 48 | 14 | 16 | 18 |
| New Zealand - since 2002 | 10 | 4 | 4 | 2 |
| India - overall | 5 | 1 | 4 | 0 |
If the trend from the previous New Zealand-India Tests at this venue continues, expect batsmen from both teams to struggle to get the runs. In five previous Tests, New Zealand's batsmen average 24.43 runs per wicket, which is four runs better than what the Indians have managed. There have been 13 fifty-plus scores from the home team, but Geoff Howarth was the only one to convert it into a century. The Indians have had three centurions here - Sachin Tedulkar, Mohammad Azharuddin and Ajit Wadekar - but they've also had many more low scores.
| Team | Tests | Runs | Average | 100s/ 50s |
| New Zealand | 5 | 1857 | 24.43 | 1/ 12 |
| India | 5 | 1834 | 20.15 | 3/ 4 |
Recent stats also suggest the conditions here are excellent for seam and swing: in the last ten Tests here, since 2002, fast bowlers average 26.47 runs per wicket. The average for the spinners - who have only taken 55 wickets during this period - is exactly ten runs more.
| Type | Wickets | Average | Stike rate | 5WI/ 10WM |
| Pace | 254 | 26.47 | 51.8 | 14/ 1 |
| Spin | 55 | 36.47 | 79.1 | 2/ 2 |
Among the New Zealand bowlers in the current squad, the fast men have all done well here: Kyle Mills has taken 15 wickets in four Tests; Chris Martin has 40 from nine, with four five-wicket hauls. The strike rates for the fast bowlers is excellent too: it's in the late 40s for Martin and James Franklin, while Mills, who has the best average but the poorest strike rate among the four, takes a wicket every six overs. The stats aren't as impressive for Daniel Vettori, though - in 16 Tests he has taken 44 wickets, and average of less than three wickets per match, with each costing him 38 runs. His only five-wicket haul here was against Sri Lanka in 2006 in a rare match dominated by spin - Muttiah Muralitharan took 10 for 118 to take his team to victory.
| Bowler | Tests | Wickets | Average | Strike rate | 5WI/ 10WM |
| Kyle Mills | 4 | 15 | 23.93 | 53.4 | 0/ 0 |
| Iain O'Brien | 2 | 6 | 25.66 | 50.0 | 0/ 0 |
| Chris Martin | 9 | 40 | 26.45 | 47.5 | 4/ 0 |
| James Franklin | 4 | 17 | 28.00 | 49.7 | 1/ 0 |
| Daniel Vettori | 16 | 44 | 38.11 | 82.0 | 1/ 1 |
With the stats so heavily in favour of fast bowlers, it's hardly surprising that teams winning the toss have mostly put the opposition in to bat: in the last ten Tests, the captains have taken this route seven times, and five times they've gone on to win the match.
The innings-wise average runs per wicket indicates, there isn't much difference in the first three innings, but in the fourth innings teams have done significantly better, suggesting again that bowling first have historically been a good option here.
| 1st innings | 2nd innings | 3rd innings | 4th innings |
| 28.87 | 28.64 | 24.13 | 43.19 |
The partnership stats too suggest that batting later in the innings is easier than tackling the new ball: average partnership for the first two wickets is less than 30, but it increases to 43.78 for the fourth wicket.
Among the Indian batsmen in the current squad, Sachin Tendulkar and Rahul Dravid are the only ones to have played more than one Test at the Basin Reserve. Tendulkar has done well here, with three 45-plus scores in four innings. Dravid, though, averages 27.75.
Those who only played in 2002-03 have hardly scored any runs here, which isn't surprising since India totalled 161 and 121 in their two innings: Virender Sehwag scored 14 in two innings, while VVS Laxman failed to score a run in the match.
S Rajesh is stats editor of Cricinfo