A giant in the T20 format
The difference between Chris Gayle and the next-best on key parameters indicates his excellence in the format
S Rajesh
Apr 18, 2017, 4:17 PM
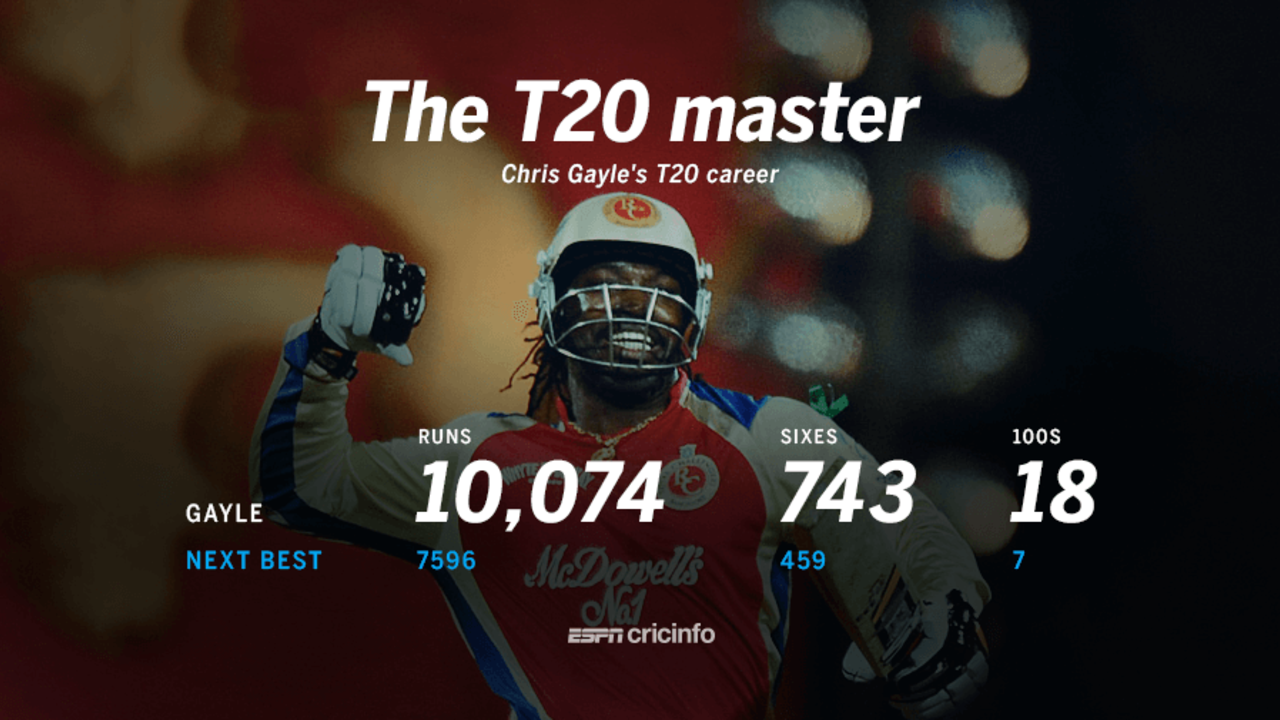
Chris Gayle's T20 numbers dwarf the rest of the competition • ESPNcricinfo Ltd
2478 The difference in aggregate between Chris Gayle and the next-highest in the T20s - Brendon McCullum is in second place with an aggregate of 7596. To put that aggregate difference in perspective, the difference between the aggregates of McCullum and the 20th-ranked Mahela Jayawardene is only 2069.
284 The difference between the number of sixes hit by Gayle and the next-highest in T20s - Gayle has struck 743 sixes, while Kieron Pollard is second with 459. The difference between Pollard and the 20th-ranked Cameron White is only 247.
| Player | Mat | Runs | Ave | SR | 100s |
| CH Gayle | 290 | 10,074 | 40.62 | 149.51 | 18 |
| BB McCullum | 272 | 7596 | 31.51 | 138.31 | 7 |
| BJ Hodge | 270 | 7338 | 36.87 | 131.27 | 2 |
| KA Pollard | 363 | 7087 | 30.54 | 151.72 | 0 |
| DA Warner | 227 | 7156 | 35.42 | 143.40 | 5 |
| Shoaib Malik | 271 | 6909 | 37.34 | 123.44 | 0 |
| DR Smith | 289 | 6767 | 26.22 | 126.79 | 3 |
| V Kohli | 212 | 6667 | 41.40 | 132.91 | 4 |
| SK Raina | 250 | 6589 | 33.44 | 138.80 | 3 |
| LJ Wright | 266 | 6296 | 28.61 | 144.8 | 6 |
74.8 Percentage of Gayle's T20 runs which have come in boundaries - he has hit 769 fours and 743 sixes. Among batsmen with at least 4000 T20 runs, the next-best percentage is Virender Sehwag's 69.7.
| Player | Runs | SR | 4s | 6s | % bound |
| CH Gayle | 10,074 | 149.51 | 769 | 743 | 74.79 |
| V Sehwag | 4061 | 147.83 | 487 | 147 | 69.69 |
| RE Levi | 4386 | 143.85 | 446 | 211 | 69.54 |
| MJ Lumb | 4955 | 138.02 | 595 | 175 | 69.22 |
| DR Smith | 6767 | 126.79 | 642 | 323 | 66.60 |
| BB McCullum | 7596 | 138.31 | 726 | 357 | 66.43 |
| SR Watson | 5636 | 138.95 | 497 | 287 | 65.83 |
| DA Warner | 7156 | 143.40 | 718 | 297 | 65.04 |
| KA Pollard | 7087 | 151.72 | 458 | 459 | 64.71 |
| Yuvraj Singh | 4254 | 132.23 | 327 | 241 | 64.74 |
18 Number of different teams for whom Gayle has played T20s. Apart from West Indies, they are: Barisal Bulls (also named Barisal Burners), Chittagong Vikings, Dhaka Gladiators, Jamaica, Jamaica Tallawahs, Karachi Kings, Kolkata Knight Riders, Lahore Qalandars, Lions, Matabeleland Tuskers, Melbourne Renegades, PCA XI, Royal Challengers Bangalore, Somerset, Stanford Superstars, Sydney Thunder and Western Australia.
15 T20 hundreds for Gayle in the period between 2011 and 2015, from 174 innings, which is an average of 11.6 innings per hundred. In the period before 2011 he scored one century in 51 innings, and since 2015 he has scored two in 56 innings. During the five-year period between 2011 and 2015, no other batsman scored more than five hundreds; the next-best was Michael Klinger with five.
6 Consecutive calendar years - from 2011 to 2016 - in which Gayle struck at least two T20 hundreds. Before 2011, he had hit only one T20 hundred.
| Period | Inngs | Runs | Ave | SR | 100s | Dot % | BpB |
| Before 2011 | 51 | 1379 | 29.97 | 134.79 | 1 | 45.8 | 4.9 |
| 2011 to 2015 | 174 | 7094 | 48.58 | 152.36 | 15 | 42.4 | 4.4 |
| 2016 onwards | 60 | 1601 | 28.58 | 151.18 | 2 | 47.3 | 4.3 |
1 Batsman with a strike rate better than Gayle's 149.56, among the 49 who have scored 4000-plus T20 runs: Pollard has a strike rate of 151.72.
43.6 Dot-ball percentage for Gayle. Among batsmen with 4000-plus runs, only two batsmen have a higher dot percentage: Dwayne Smith (46.5), and Lendl Simmons (45.8). (For matches where ball-by-ball data is available.)
S Rajesh is stats editor of ESPNcricinfo. @rajeshstats