Which were the most dominant teams in the T20 World Cup?
An analysis of the tournament that looks at resources remaining at the end of each match
Anantha Narayanan
Dec 4, 2021, 1:43 AM
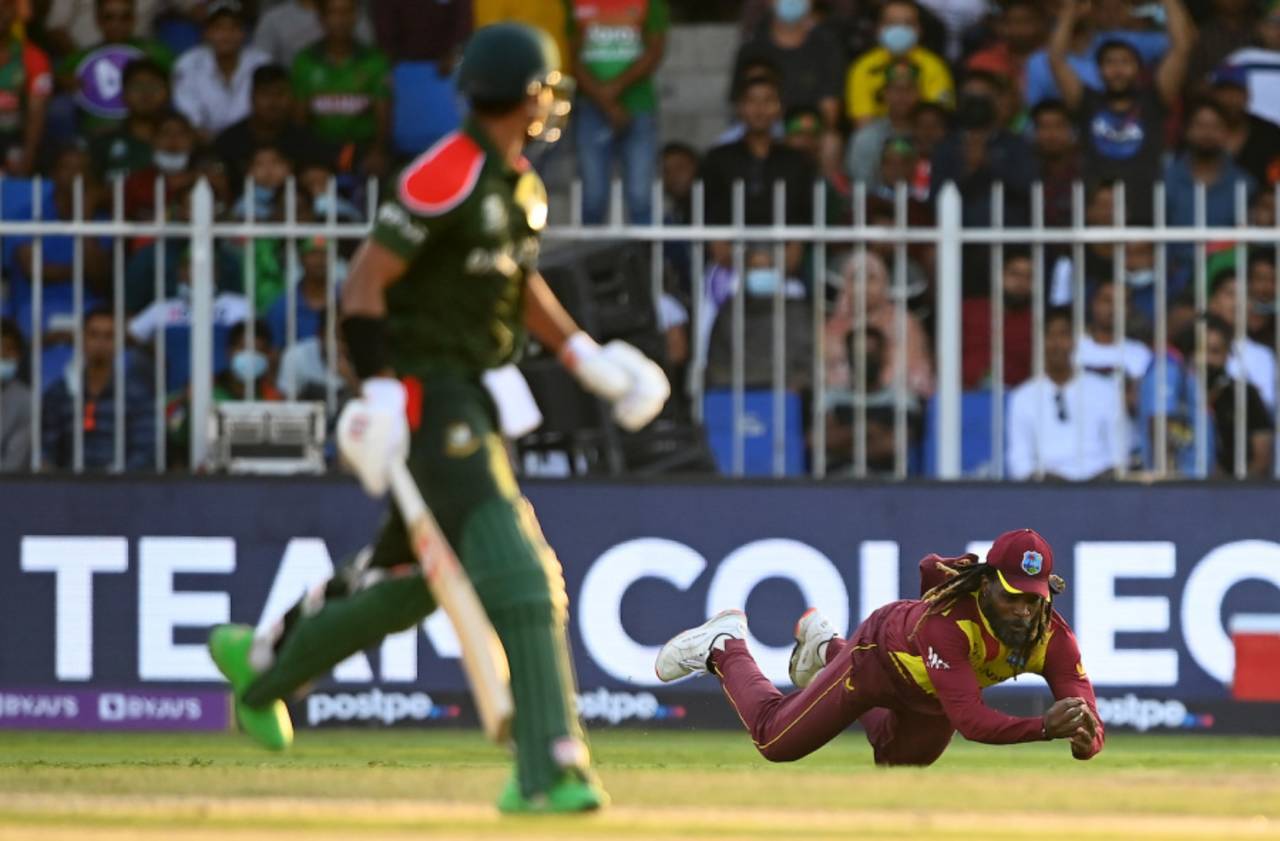
West Indies' match against Bangladesh at the T20 World Cup was the one where the teams were most closely matched • Getty Images
The last time I wrote an article on the T20 format was over four and a half years back. Since then, I have concentrated on the two longer formats. However, the recent T20 World Cup was an intriguing one and I wanted to make a special one-off effort to write an alternative summary for it. I will not talk about the toss, the dew, India's performances, the bio-bubbles, net run rate and the like. Instead, I will talk about Team Performance Points (TPP), grounds summaries, what the teams did overall, and so on. Incidentally, I had to create a small one-time database for this article.
In any T20 match, there are two types of resources available to the batting team. The number of balls, limited to 120, and the number of wickets, limited to ten. It is by now confirmed that it is the first of these that is the limiting factor. The average bowling strike rate for all T20I matches is around 19 balls per wicket, and the average number of wickets lost per match is 11.5. Only in 441 T20 matches (out of 1447 played so far) have teams lost all ten wickets in at least one innings. So the number of balls available is the dominant limiting resource.
The net run rate (NRR), although a very effective measure, does not really convey much in terms of teams' dominance. Two teams winning by identical NRR difference are treated identically. However, one team might have lost one wicket and the other eight.
Let us now come to the types of wins. The two types of wins have to be handled independently. A team winning by wickets has not completed its innings and resources left, in terms of balls not faced. It is clear that a team that wins with 30 balls to spare has had a more dominant win than a team winning with six to spare. It is also clear that a team that wins with eight wickets to spare has had a more dominant win than a team winning with two wickets to spare. So what is needed is a clearly defined methodology while considering the range of resources available. (And because the balls are the limiting factor, more weight needs to be given to them than to the wickets available.)
Ignoring DLS situations, a team wins by runs when both teams have had their full complement of 20 (or fewer) overs. It is clear that a team scoring 160 and winning by 60 runs has had a far more dominating win than a team that scores 160 and wins by ten runs. While accepting that the wickets lost in the first innings have had no impact on the margin, it is clear that a team scoring 160 for 2 and winning by 30 runs has had a more dominating win than a team that scores 160 for 8 and winning by 30 runs. For a runs win, I will take the base as 75% of the winning team's score: any team that wins by 75% of the runs scored will get full points.
Let me first look at wins by wickets. The winning team starts with a TPP value of 50 points. The following points are added to these. The losing team gets 100 minus the winning team's TPP.
A win where the target is chased within the powerplay is very rare indeed. I will take that as the base. Any team that wins by the end of the sixth over will get full credit. Until now, only 14 matches have been won within proper powerplays. The rest will be given proportionate credit, with 84 balls as the denominator.
Wickets are straightforward and the team will get credit for wickets still available. Thirty points will be allotted for the balls resource and 20 for the wickets resource.
Here are a couple of examples. I will take the two Indian losses in the World Cup since these were heavily followed.
In the match against Pakistan, India scored 151 and Pakistan chased this down with 13 balls and all ten wickets to spare. Pakistan get 50 points for the win and 4.6 points for the 13 balls still available (30 x 13 / 84). They also get the full 20 points for the ten-wicket win, so their total is 74.6 TPPs. India get 25.4 TPPs. Looks very fair, indeed.
In the match against New Zealand, India scored 110 and New Zealand chased this down with 33 balls and eight wickets to spare. New Zealand get 50 points for the win and 11.8 points for the 33 balls still available (30 x 33 / 84). They also get 16 points for the eight-wicket win, so their total is 77.8 TPPs. India get 22.2 TPPs. Note that New Zealand's win is more dominant since their balls-remaining resource is much more. Look at it another way: they could have scored another 50 runs in the 33 balls available, while Pakistan could only have scored another 20 more.
Now for wins by runs. Forty points will be allotted for the run margin, and ten points for the wickets resource. Again, a couple of examples.
Afghanistan scored 190 for 4 in 20 overs, then dismissed Scotland for 60 and won by 130 runs. This huge win fetched them 92.5 TPPs. They get 50 points for winning, 36.5 points for the 130-run win (40 x 130 / 142.5) and six points for keeping six wickets in hand (10 x 6 / 10) in their first innings - 142.5 is 75% of 190. Note the low weight for the wickets. This is indeed a really huge win.
Let us now look at a close win. West Indies scored 142 for 7 in 20 overs, and restricted Bangladesh to 139 for 5 and won by three runs. This narrow win fetched them 54.1 TPPs. They get 50 points for winning, 1.1 points for the three-run win (40 x 3 / 107) and three points for keeping three wickets in their first innings. This is a very narrow win and the points received reflects this.
In summary, in wicket wins, the weights are closer (30 and 20) since all relevant numbers are in the second innings. In run wins, the weights are further apart (40 and 10) since the wickets measure applies to the first innings. Some might even say that the number of wickets lost by the winning team in setting up the winning score need not be considered. However, I have kept this low weight to take care of two contrasting situations such as 160 for 3 defeating 130 versus 160 for 8 defeating 130. The margin is identical but the latter team expended a lot more wicket resources. The TPP values of 67.0 and 62.0 reflect this difference.
The main analysis incorporates only the tournament proper, consisting of 33 matches. At the end, I have given a table of the qualifying part of the World Cup.
The first table covers the top eight matches in which the winning teams were totally dominant.
The most dominating match of the World Cup was played by Australia. After dismissing Bangladesh for a low 73, Australia wasted no time and reached this target with 82 balls to spare and eight wickets in hand. The TPP was a mammoth 95.28 (50 + 30*82/84 + 20* 8/10). They scored at over 12 runs per over. And every one of the "balls in hand" was important since they qualified at South Africa's expense because of the magnitude of this win. India's win against Scotland was a notch lower; they took one ball more. This kept their TPP to 94.92. This example highlights how well this TPP metric works in accounting for resources used and unspent.
Now comes the only match in the top eight that was won by the team batting first. Afghanistan scored 190 for 4 and defeated Scotland by 130 runs. Afghanistan secured 92.49 TPPs (50 + 40*(130/(0.75*190)) + 10*6/10) and fully deserve this high placing. Next up is the West Indies-England match - West Indies scored a miserable 55 but England took their time and lost wickets. Their TPP was 87.0 (50 + 30*70/84 + 20*6/10).
England's eight-wicket demolition of Australia comes next. Their TPP was 83.86 (50 + 30*50/84 + 20*8/10). It was Australia's indomitable fighting spirit that helped them recover from this result and go on to win the tournament. England's blitzkrieg against Bangladesh was almost equally devastating, except that they needed 15 more balls to reach an identical target - a TPP of 78.50 (50 + 30*35/84 + 20*8/10).
India's nothing-at-stake hammering of Namibia follows next. They took over 15 overs to overhaul Namibia's 132 but lost only one wicket and secured a TPP of 78.0 (50 + 30*28/84 + 20*8/10). The final entry in the table is New Zealand's win over India. New Zealand secured 77.78 TPPs (50 + 30*33/84 + 20*8/10).
When South Africa missed qualification for the knockout rounds quite narrowly on NRR, commentators reflected on their dawdling win against Bangladesh. That win does not even get into the top eight. In that match, Bangladesh scored 84 and South Africa's laboured chase meant that they won with 39 balls and six wickets to spare. Their TPP was 75.9 - a comprehensive win, indeed. However, compare this against Australia's win against Bangladesh - a far more dominating win securing 95.3 TPPs. This huge difference effectively explains what happened.
The table above features the closest eight matches in the main tournament.
The closest win was by West Indies, who managed to carve out a three-run victory over Bangladesh. They defended 142 for 7 and secured a TPP value of 54.12 (50 + 40*(3/(0.75*142)) + 10*3/10).
South Africa had a single ball to spare when they defeated Sri Lanka and secured 58.35 TPPs (50 + 30*1/84 + 20*4/10).
Namibia had five balls to spare when they defeated Scotland to secure their only win in main round of the World Cup. Their TPP tally was 59.78 (50 + 30*5/84 + 20*4/10).
New Zealand's 16-run win over Scotland secured them only 59.96 TPPs (50 + 40*(16/(0.75*172)) + 10*5/10).
Australia's tough opening-day win over South Africa is next with 60.71 TPPs (50 + 30*2/84 + 20*5/10). The closeness of the contest is reflected in the 60-40 TPP scoreline.
Then comes South Africa's brave but futile win over England. They won the match and hearts but could not cross the NRR hurdle. They earned 60.82 TPPs (50 + 40*(10/(0.75*189)) + 10*8/10).
Australia's semi-final win over the impressive Pakistan comes in next. Australia had six balls and five wickets to spare while chasing 177 and secured the tally of 62.14 TPPs (50 + 30*6/84 + 20*5/10). The fact that the other semi-final was a mirror image of this match is confirmed by the TPP scoreline of 62.14 for New Zealand. (Asif Ali's blitz, which led to Pakistan's five-wicket win with six balls to spare against Afghanistan also secures 62.14 TPPs.)
The table above is a summary of the World Cup for the point of view of the 12 teams. The table is ordered by the win percentages of the teams.
Fittingly, Australia lead this table, with a win percentage of 85.7, having won five of their six matches, their only loss being the trouncing at the hand of England. All their wins were secured batting second and their only loss was while batting first. At 63.9, theirs is the third-best TPP average, mainly due to this huge loss.
Pakistan had an impeccable tournament until the semi-finals. They won five straight matches, defending as well as chasing. A poor over by their best bowler cost them a place in the final. Their TPP average was above 64.
South Africa would rue their poorly planned chase against Bangladesh. Their only loss was the close one against Australia on day one. Their TPP average was a not-so-high 60.8.
New Zealand lost a close match against Pakistan and sustained a resounding loss in the final. The closeness of many of their matches is reflected in the rather low TPP average of 58.8.
In some ways, England had an excellent tournament. Look at their TPP average, which is the highest, at 65.1. However, their substandard bowling towards the end of the semi-final cost them.
India's tournament has been chronicled often enough, so I'll avoid a repeat here. Three heavy wins could not compensate for two heavy losses. A win percentage of only 60 and a middling TPP average of 58.9 defined their tournament.
The other teams had win% values below 50. Afghanistan won one match fewer than India but were in the semi-final race till late in the tournament. Sri Lanka were never in the hunt. The other four teams had eminently forgettable tournaments, although Namibia had their first ever win in World Cups.
The team of the tournament was undoubtedly Australia, for many reasons, not least being the fact that they were the ones standing with the trophy at the end. Maybe closely followed by New Zealand and Pakistan.
The table above covers matches by the grounds where they were played, and in the tournament as a whole.
It is clear from the numbers that Dubai was primarily responsible for the lopsided benefit of bowling first. Of the 13 matches played there, an outrageous 12 were won by the teams chasing. Abu Dhabi was better, with four wins out of 11 for the team batting first. Sharjah went the other way, with six out of nine wins for the team batting first. If Abu Dhabi and Sharjah are taken together, the ratio is a perfectly balanced ten out of 20 matches won batting second.
The average winning TPPs have been 75.7, 69.5 and 67.2 for Dubai, Abu Dhabi and Sharjah respectively. That implies, by the number of wins and also the margin of wins, that the venue changed character dramatically as the sun went down. Once the first innings were out of the way, the teams batting second just seemed to coast through. There were very few close matches. Abu Dhabi and Sharjah were relatively better.
The average first-innings scoring rate in Dubai was 6.86, and for the second innings it was 8.83, nearly two runs more. This indicates how tough first innings in Dubai were and how easy the chasing was. For Abu Dhabi, the figures were 7.28 and 7.47 - the second innings marginally better. For Sharjah, the values were 8.24 and 7.18, the first innings a fair bit more comfortable to bat in.
This last table covers the 12 qualifying matches, listed in order of the TPP differences. The most dominant match stands at 93.5 TPPs: Sri Lanka took just over seven overs to reach a paltry target of 45 and secured 93.5 TPPs against Netherlands. Oman's opening-day win over Papua New Guinea (PNG) by ten wickets comes next. However, they had fewer than seven overs to spare. Then comes Sri Lanka's comprehensive win over Namibia. The closest match was Scotland's six-run upset win over Bangladesh. However, this was a more even phase of the World Cup. Five of the matches were won by teams batting first.
In summary, I would say that, the undue importance to the toss notwithstanding, it was a very good tournament because there were very few runfests. There was only one 200-plus score and one individual century. And there is no doubt that the two most deserving teams competed in the final and the better team on that day won the tournament, fair and square.
Calling for an all-time XV
In 2013 I ran a readers' poll to determine a group of 15 players to be considered for an all-time World team. The response was excellent and the results very insightful and interesting. I now call for submissions again, since new contenders have emerged, as also new measures for selection. This is the last intimation. You can email your entries in one of three ways, with the subject "All-time XV - 2021".
In 2013 I ran a readers' poll to determine a group of 15 players to be considered for an all-time World team. The response was excellent and the results very insightful and interesting. I now call for submissions again, since new contenders have emerged, as also new measures for selection. This is the last intimation. You can email your entries in one of three ways, with the subject "All-time XV - 2021".
- Send an email to my personal mail id, if you have it
- Send an email to the email id at the bottom of this article
- Send an email to the Talking_Cricket group, more on which below
- Send an email to the email id at the bottom of this article
- Send an email to the Talking_Cricket group, more on which below
When sending in your XV, provide your name, place of residence, and your list of 15 players (no more, no less). The team must be an all-terrain one. A manager/coach is optional. If you send multiple entries from one email id, I will consider the last one sent. Thus, you have the opportunity to change your selections. You don't have to justify your selections; I prefer short emails. The entries should reach me by December 15. The entry that matches the final selection or comes closest to it will be acknowledged. This is the break-up of the squad by role:
- eight batters/allrounders
- one wicketkeeper
- four pace bowlers
- two spinners
- one wicketkeeper
- four pace bowlers
- two spinners
Talking Cricket Group
Any reader who wishes to join the general purpose cricket ideas-exchange group of this name that I started last year can email a request for inclusion, giving their name, place of residence and what they do.
Any reader who wishes to join the general purpose cricket ideas-exchange group of this name that I started last year can email a request for inclusion, giving their name, place of residence and what they do.
Email me your comments and I will respond. This email id is to be used only for sending in comments. Please note that readers whose emails are derogatory to the author or any player will be permanently blocked from sending any feedback in future.
Anantha Narayanan has written for ESPNcricinfo and CastrolCricket and worked with a number of companies on their cricket performance ratings-related systems