Warner, Badree grab top spots
Analysis of individual batting and bowling performances in the Champions League Twenty20
Madhusudhan Ramakrishnan
Oct 22, 2012, 5:41 PM
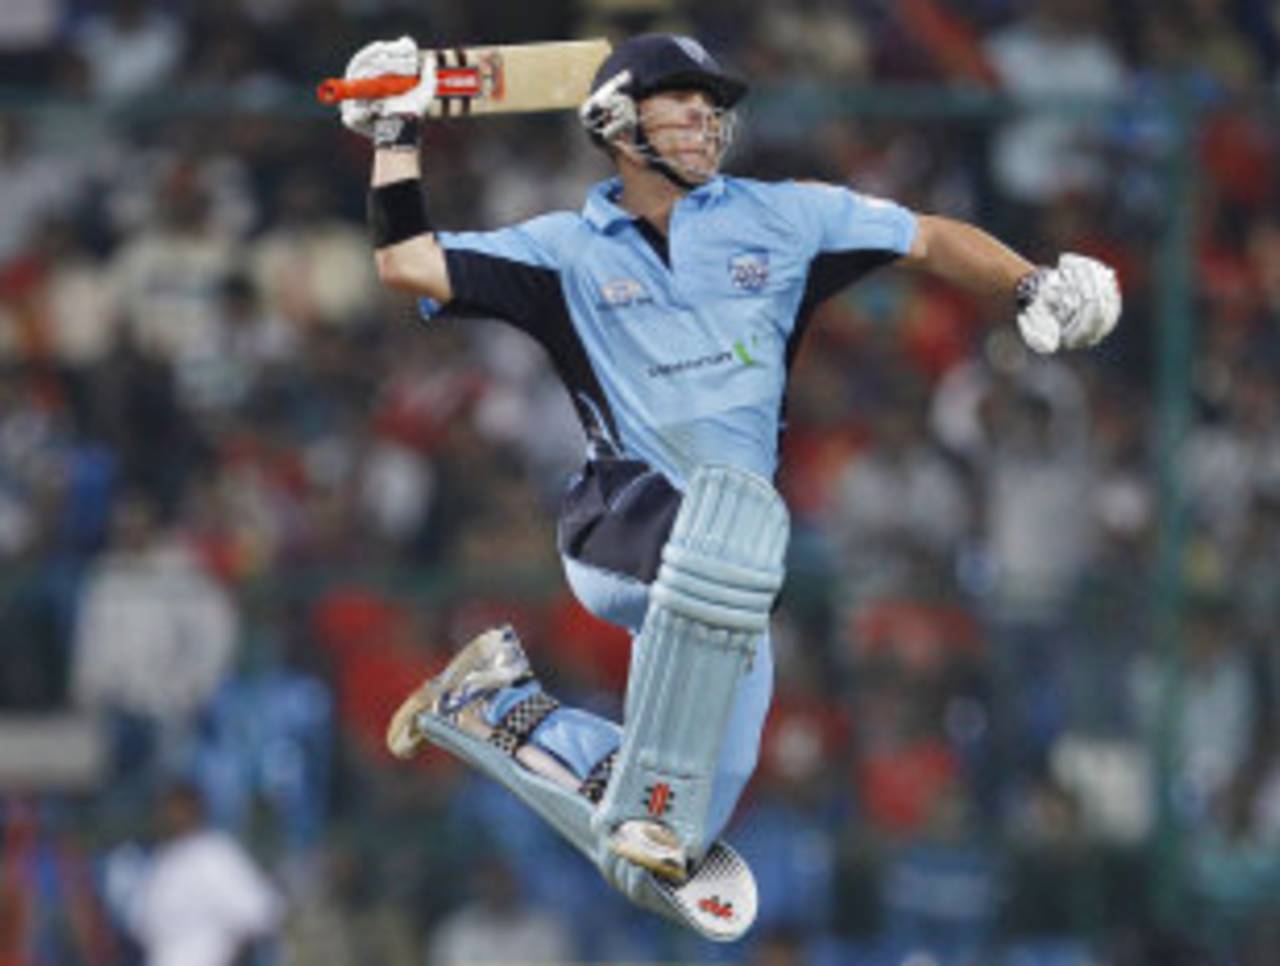
David Warner's 135 against Chennai Super Kings in 2011 is the best innings according to ESPNcricinfo's analysis of Champions League Twenty20 performances • Associated Press
In ESPNcricinfo's analysis of individual performances in Champions League Twenty20 matches, David Warner and Samuel Badree take the honours on the batting and bowling fronts respectively. Warner, one of the highest run-getters in the Twenty20 format, is on top for his superb 135 off 69 balls against Chennai Super Kings in the 2011 tournament. Kieron Pollard slots in at second place for his stunning 54 off 18 balls against New South Wales in 2009. The top-ten list in batting is dominated by the big hitters with Warner, Pollard and Suresh Raina featuring twice each. Chris Gayle, the leading century-getter in Twenty20 matches (eight centuries) comes in at ninth for his 92 off 41 balls in the 2011 semi-final against NSW.
Trinidad & Tobago, the runners-up in the inaugural tournament, have both their spinners Badree and Sunil Narine in the top three. While Badree leads the way for his 2 for 7 in the qualifying game against Leicestershire, Narine comes in third for his impressive 3 for 8 in a low-scoring encounter against Chennai Super Kings in 2011. Shaun Tait's 5 for 32 against Royal Challengers Bangalore in 2011, which is in the second place, was an exceptional effort in an extremely high-scoring game. Auckland have two bowlers in the top ten with Kyle Mills' 2 for 6 against Sialkot Stallions in the fourth position and Azhar Mahmood's 5 for 24 against Hampshire in the sixth spot. The top ten is rounded off by L Balaji, who picked up 4 for 19 in Kolkata Knight Riders' crushing 99-run win in their last group game against Titans.
Warner dominated the tournament in 2011 ending as the highest run-getter. His 135 in the group game against Chennai was scored at a strike rate of 195.65 with 92 runs in boundaries. The combined strike rate of the other batsmen in the game was just 126.66 and none of them managed a score over 40. In the game against NSW, Pollard walked in with T&T requiring 54 runs off 28 balls with four wickets in hand. His explosive 54 (strike rate of 300) swung the game around completely with T&T knocking off the remaining runs in 19 balls. Pollard, who scored 50 of his runs in boundaries, had a strike rate that was nearly three times the corresponding figure of the other T&T batsmen (116.12). In third place is Wes Durston's 57 off 32 balls for Somerset against Eagles in 2009. Durston's strike rate of 178.12 was comfortably higher than what the rest of the batsmen managed (92). Both Pollard and Warner make their second appearance in the top ten at fourth and sixth positions respectively. However, Warner's second century of the tournament (123) was unable to prevent defeat in the semi-final against Royal Challengers, who overhauled the huge target of 204 with the help of Gayle's 92 (strike rate 224.39), which slots in at ninth. The two other centuries scored in the Champions League Twenty20 come in at tenth (Andrew Puttick) and 12th (Daniel Harris). The only knock from this year's tournament that makes it to the top 15 is Gary Ballance's 64 off 25 balls for Yorkshire in their qualifying match against T&T.
All stats updated till the end of the matches on Oct 21, 2012
| Batsman | Team | Opposition | Runs | Balls faced | Points |
| David Warner | NSW | Chennai Super Kings | 135 | 69 | 70.43 |
| Kieron Pollard | Trinidad & Tobago | NSW | 54 | 18 | 67.49 |
| Wes Durston | Somerset | Eagles | 57 | 32 | 60.82 |
| Kieron Pollard | Mumbai Indians | Guyana | 72 | 30 | 58.20 |
| Suresh Raina | Chennai Super Kings | Royal Challengers Bangalore | 94 | 48 | 58.03 |
| David Warner | NSW | Royal Challengers Bangalore | 123 | 68 | 56.20 |
| JP Duminy | Cape Cobras | Royal Challengers Bangalore | 99 | 52 | 53.76 |
| Suresh Raina | Chennai Super Kings | Wayamba | 87 | 44 | 53.16 |
| Chris Gayle | Royal Challengers Bangalore | NSW | 92 | 41 | 51.73 |
| Andrew Puttick | Cape Cobras | Otago | 104 | 62 | 50.94 |
| Richard Cameron | Lions | Guyana | 78 | 42 | 50.51 |
| Daniel Harris | South Australia | Royal Challengers Bangalore | 108 | 61 | 50.02 |
| Aaron Finch | Victoria | Central Districts | 93 | 60 | 49.88 |
| Roelof van der Merwe | Somerset | Kolkata Knight Riders | 73 | 40 | 49.66 |
| Gary Ballance | Yorkshire | Trinidad & Tobago | 64 | 25 | 47.53 |
Badree's 2 for 7 in the qualifying game against Leicestershire is the best bowling performance followed by Tait's 5 for 32. Badree finished with an economy rate of just 1.75 in a game where the run-rate was over seven runs per over. In addition, both his wickets were those of top-order batsmen. In a game dominated by batsmen (run-rate of 10.72), Tait's figures were outstanding. All five of his wickets were those of top-seven batsmen including Tillakaratne Dilshan and Virat Kohli, the top scorers for Royal Challengers. Narine's effort came after T&T had been restricted to just 123. He dismissed M Vijay and Raina before returning to remove the dangerous MS Dhoni as T&T managed to defend the low target. Despite the game being a low-scoring one, Narine's economy rate of 2.00 was well below the match run-rate of 5.85. Both Azhar Mahmood's 5 for 24 against Hampshire in the qualifying game and Lasith Malinga's 5 for 32 in the dead-rubber clash with Chennai finish in the top ten. Despite the lack of wickets, Dilshan's 1 for 10 against NSW is in 11th place because of the top-class economy rate (2.50) in an extremely high-scoring game (run-rate 10.57). No other bowler in the game ended with an economy rate below seven runs per over.
| Bowler | Team | Opposition | Wickets | Runs | Points |
| Samuel Badree | Trinidad & Tobago | Leicestershire | 2 | 7 | 72.13 |
| Shaun Tait | South Australia | Royal Challengers Bangalore | 5 | 32 | 71.25 |
| Sunil Narine | Trinidad & Tobago | Chennai Super Kings | 3 | 8 | 67.91 |
| Kyle Mills | Auckland | Sialkot Stallions | 2 | 6 | 67.60 |
| JP Duminy | Cape Cobras | Chennai Super Kings | 4 | 20 | 67.31 |
| Azhar Mahmood | Auckland | Hampshire | 5 | 24 | 66.68 |
| Andrew McDonald | Victoria | Royal Challengers Bangalore | 4 | 21 | 66.33 |
| Cornelius de Villiers | Eagles | Somerset | 4 | 17 | 65.38 |
| Lasith Malinga | Mumbai Indians | Chennai Super Kings | 5 | 32 | 65.34 |
| L Balaji | Kolkata Knight Riders | Titans | 4 | 19 | 65.13 |
| Tillakaratne Dilshan | Royal Challengers Bangalore | NSW | 1 | 10 | 61.34 |
| Aaron Phangiso | Lions | Sydney Sixers | 3 | 14 | 61.27 |
| Ravi Rampaul | Trinidad & Tobago | Leicestershire | 4 | 14 | 61.26 |
| Pat Cummins | NSW | Royal Challengers Bangalore | 4 | 45 | 61.23 |
| Dirk Nannes | Delhi Daredevils | Wayamba | 4 | 24 | 60.72 |
Madhusudhan Ramakrishnan is a sub-editor (stats) at ESPNcricinfo