Pakistan's unpredictability sets up even contest
Pakistan have been utterly dominant in World Cup clashes against New Zealand, but their fickle form in recent times raises the prospect of a close contest
Madhusudhan Ramakrishnan
Mar 7, 2011, 4:33 PM
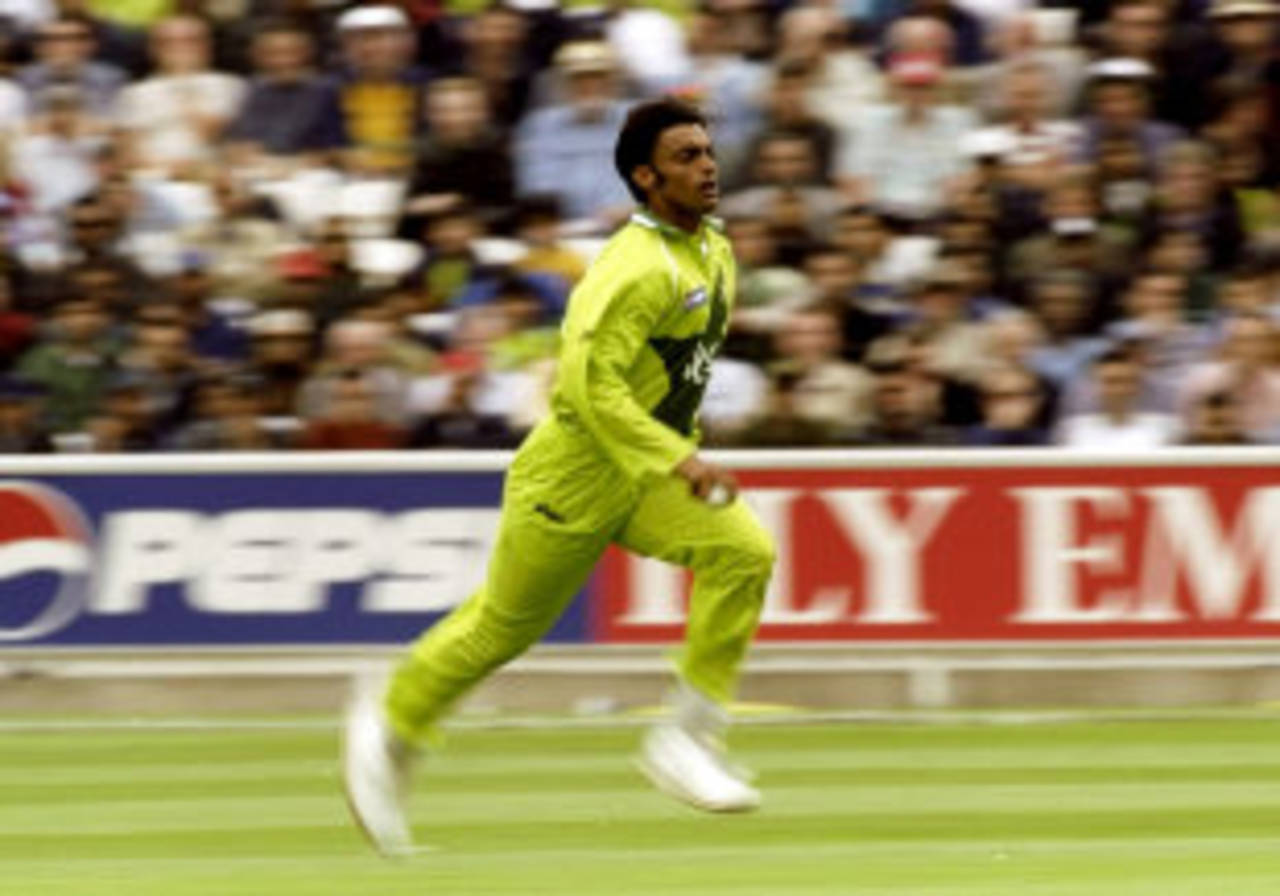
Shoaib Akhtar destroyed New Zealand in the World Cup 1999 semi-final • Getty Images
Pakistan dominate World Cup clashes
New Zealand have been one of the most consistent sides in global competitions. While their solitary title came in the 2000 Champions Trophy, they have made the semi-finals of the 1992, 1999 and 2007 World Cups and the finals of the Champions Trophy in 2009. Yet, New Zealand have always struggled to perform against Pakistan in World Cups. Their only World Cup win against Pakistan came in their first ever meeting in 1983. Since then, Pakistan have won all six matches, including a comprehensive nine-wicket win in the 1999 semi-final. The story is a little different when it comes to clashes in the Champions Trophy. New Zealand have won all three of their meetings including the most recent one in the 2009 edition.
New Zealand have been one of the most consistent sides in global competitions. While their solitary title came in the 2000 Champions Trophy, they have made the semi-finals of the 1992, 1999 and 2007 World Cups and the finals of the Champions Trophy in 2009. Yet, New Zealand have always struggled to perform against Pakistan in World Cups. Their only World Cup win against Pakistan came in their first ever meeting in 1983. Since then, Pakistan have won all six matches, including a comprehensive nine-wicket win in the 1999 semi-final. The story is a little different when it comes to clashes in the Champions Trophy. New Zealand have won all three of their meetings including the most recent one in the 2009 edition.
Pakistan boast the better record in head-to-head matches and have also dominated the matches played in the subcontinent since 2000. However, Pakistan's recent problems and unpredictability have meant that New Zealand have been the slightly better team in matches played in the last three years, winning five games to Pakistan's four. After their win in the Champions Trophy game, New Zealand also won the three-match series in Abu Dhabi 2-1. Pakistan, though, can take confidence from their 3-2 win in the ODI series played in New Zealand in 2010.
| Played | Won | Lost | W/L ratio | |
| Overall | 88 | 51 | 34 | 1.50 |
| Matches since 2000 | 38 | 21 | 16 | 1.31 |
| In Asia since 2000 | 20 | 15 | 5 | 3.00 |
| Since Jan 2008 | 10 | 4 | 5 | 0.80 |
| In World Cup | 7 | 6 | 1 | 6.00 |
| Champions Trophy | 3 | 0 | 3 | 0.00 |
Clash of two inconsistent sides
Both teams have been among the more inconsistent sides in the last two years. New Zealand, after an excellent show in the Champions Trophy in 2009, lost their way in 2010, going down 4-0 to Bangladesh and 5-0 to India. Pakistan lost 5-0 to Australia in early 2010, but since then, recovered to contest two close series against England and South Africa, which they lost 3-2. The 3-2 series win in New Zealand in early 2011 has been followed by three excellent matches in the World Cup, including the 11-run win over Sri Lanka. New Zealand, on the other hand, have looked inconsistent in the tournament so far. They have had two very comfortable wins over Kenya and Zimbabwe, but suffered a heavy loss to Australia.
Both teams have been among the more inconsistent sides in the last two years. New Zealand, after an excellent show in the Champions Trophy in 2009, lost their way in 2010, going down 4-0 to Bangladesh and 5-0 to India. Pakistan lost 5-0 to Australia in early 2010, but since then, recovered to contest two close series against England and South Africa, which they lost 3-2. The 3-2 series win in New Zealand in early 2011 has been followed by three excellent matches in the World Cup, including the 11-run win over Sri Lanka. New Zealand, on the other hand, have looked inconsistent in the tournament so far. They have had two very comfortable wins over Kenya and Zimbabwe, but suffered a heavy loss to Australia.
Both Pakistan and New Zealand have been among the poorer ODI teams over the last three years. While South Africa are on top, with an average difference of 12.1 and run-rate difference of 0.54, Pakistan and New Zealand rank well below with extremely low average and run-rate differences. Pakistan have been the slightly better batting side, but New Zealand have a slightly better bowling average and economy rate.
Pakistan's top six has been more consistent in matches played since 2008. They average nearly 37 with 22 century stands and 69 fifty partnerships. New Zealand's top order has been less inspiring and average less than 32, which is only higher than Bangladesh's. Their rate of converting half-century stands into hundreds partnerships is also poor (nearly 1:5) compared to the top teams (less than 1:3).
| Team | Matches | Runs/wicket (batting) | Run rate | Runs/wicket(bowling) | Economy rate | Average diff | Run rate diff |
| South Africa | 59 | 39.5 | 5.59 | 27.34 | 5.05 | 12.1 | 0.54 |
| Australia | 92 | 35.4 | 5.20 | 26.00 | 4.88 | 9.4 | 0.32 |
| India | 95 | 37.2 | 5.61 | 31.59 | 5.37 | 5.62 | 0.24 |
| Sri Lanka | 83 | 31.8 | 5.15 | 27.77 | 4.92 | 3.98 | 0.23 |
| Pakistan | 68 | 31.0 | 5.25 | 30.35 | 5.05 | 0.63 | 0.20 |
| New Zealand | 70 | 29.3 | 5.20 | 29.11 | 4.92 | 0.32 | 0.28 |
| England | 71 | 31.1 | 5.25 | 31.27 | 5.27 | -0.20 | -0.02 |
| West Indies | 64 | 27.7 | 5.05 | 32.39 | 5.08 | -4.70 | -0.03 |
| Bangladesh | 75 | 26.1 | 4.65 | 32.76 | 5.13 | -6.70 | -0.48 |
Comparing the batting
Despite having an ordinary time in away matches in the last year, Ross Taylor has clearly been the best New Zealand batsman since the start of 2008. Brendon McCullum and Martin Guptill batted themselves into form in the ten-wicket win over Zimbabwe and that could be an advantage against a far more potent Pakistan bowling attack. Scott Styris, who has been one of the more successful batsmen against Pakistan, had a poor outing against Australia, but his overall record in World Cups is pretty good.
Despite having an ordinary time in away matches in the last year, Ross Taylor has clearly been the best New Zealand batsman since the start of 2008. Brendon McCullum and Martin Guptill batted themselves into form in the ten-wicket win over Zimbabwe and that could be an advantage against a far more potent Pakistan bowling attack. Scott Styris, who has been one of the more successful batsmen against Pakistan, had a poor outing against Australia, but his overall record in World Cups is pretty good.
Pakistan will be buoyed by the form of Younis Khan and Misbah-ul-Haq, who were responsible for setting up Pakistan's match-winning total of 277 against Sri Lanka. The powerful lower-middle order of Shahid Afridi, Umar Akmal and Abdul Razzaq is extremely dangerous in subcontinent conditions and could be a huge factor in close matches. Afridi, despite becoming a bigger contributor with the ball, has scored two centuries in recent matches, including a stunning 109 off 76 balls in a defeat against Sri Lanka.
| Batsman | Runs | Average | SR | 100s | 50s |
| Ross Taylor | 1886 | 35.58 | 79.24 | 1 | 15 |
| Brendon McCullum | 1880 | 33.57 | 92.38 | 2 | 10 |
| Martin Guptill | 1445 | 37.05 | 82.38 | 1 | 10 |
| Scott Styris | 901 | 31.06 | 78.89 | 0 | 6 |
| Younis Khan | 1743 | 32.88 | 77.29 | 3 | 12 |
| Kamran Akmal | 1458 | 31.69 | 88.09 | 2 | 7 |
| Shahid Afridi | 1387 | 26.16 | 130.47 | 2 | 3 |
| Misbah-ul-Haq | 1365 | 48.75 | 81.29 | 0 | 11 |
Afridi's bowling the key
Afridi has been in excellent bowling form in the tournament so far, picking up 14 wickets in three games at a stunning average of 5.20. He'll probably again be the key bowler in Sri Lankan conditions which generally aid spin. Shoaib Akhtar, who destroyed New Zealand in the 1999 semi-final, has been consistent in the matches so far.
Afridi has been in excellent bowling form in the tournament so far, picking up 14 wickets in three games at a stunning average of 5.20. He'll probably again be the key bowler in Sri Lankan conditions which generally aid spin. Shoaib Akhtar, who destroyed New Zealand in the 1999 semi-final, has been consistent in the matches so far.
As usual, New Zealand will rely on the economical and consistent Daniel Vettori to deliver. Kyle Mills, who has been one of New Zealand's best bowlers in the last few years, missed the first two games of the World Cup. He returned a fine performance of 2 for 29 against Zimbabwe and will be an important bowler against Pakistan.
Pakistan's lower-order firepower
Overall, when compared to most top teams, the performance of Pakistan and New Zealand in the first 15 overs has been poor. However, New Zealand, despite averaging slightly lesser, have a better run-rate difference than Pakistan in this phase of the innings. Pakistan dominate the performance in the middle overs, with a higher average and run-rate difference. In the last ten overs, Pakistan's high run-rate clearly points to the firepower in their lower middle order. On the bowling front though, there is very little to separate both teams.
Overall, when compared to most top teams, the performance of Pakistan and New Zealand in the first 15 overs has been poor. However, New Zealand, despite averaging slightly lesser, have a better run-rate difference than Pakistan in this phase of the innings. Pakistan dominate the performance in the middle overs, with a higher average and run-rate difference. In the last ten overs, Pakistan's high run-rate clearly points to the firepower in their lower middle order. On the bowling front though, there is very little to separate both teams.
| Team | Period (overs) | Batting average | Run rate | Bowling average | Economy rate | Run rate difference |
| Pakistan | 0-15 | 36.69 | 4.50 | 36.29 | 4.91 | -0.41 |
| New Zealand | 0-15 | 32.64 | 4.93 | 33.50 | 4.60 | -0.33 |
| Pakistan | 16-40 | 34.83 | 5.06 | 32.44 | 4.62 | 0.44 |
| New Zealand | 16-40 | 29.62 | 4.76 | 31.94 | 4.67 | 0.09 |
| Pakistan | 41-50 | 21.26 | 7.52 | 21.53 | 6.93 | 0.59 |
| New Zealand | 41-50 | 22.19 | 7.19 | 20.40 | 6.94 | 0.25 |
Afridi v Vettori
Afridi, in the course of a dream start to the World Cup, picked up his 300th wicket in ODIs, making him only the fourth spinner to reach the mark. Prior to 2004, he had 131 wickets at an average over 39 with just one five-wicket haul. But since then, he has picked up 175 wickets at an average of 30.08 with three four-wicket hauls and four five wicket-hauls.
Afridi, in the course of a dream start to the World Cup, picked up his 300th wicket in ODIs, making him only the fourth spinner to reach the mark. Prior to 2004, he had 131 wickets at an average over 39 with just one five-wicket haul. But since then, he has picked up 175 wickets at an average of 30.08 with three four-wicket hauls and four five wicket-hauls.
Vettori, who has 281 wickets, has been one of the most economical bowlers in ODIs. Afridi has clearly been the more successful wicket taker in matches played since 2008. Vettori, despite not picking up a lot of wickets, has been more difficult to score off. While Afridi's record against right-handers is superb, he has struggled to dismiss left-handers, who average more than 61 and score at 5.23 runs per over off his bowling. Vettori, though, has been better than Afridi against left-handers and averages just over 36, while conceding under five runs per over.
| Bowler | Wickets | Average,ER | RHB (wickets) | RHB (average,ER) | LHB (wickets) | LHB (average,ER) |
| Shahid Afridi | 94 | 29.64, 4.60 | 78 | 23.14, 4.31 | 16 | 61.37, 5.23 |
| Daniel Vettori | 66 | 27.96, 3.89 | 50 | 25.34, 3.59 | 16 | 36.18, 4.72 |