Ashes heroes in series defeats
Only six bowlers have done better than Ryan Harris' 24 wickets at 19.58 in a losing Ashes campaign
S Rajesh
30-Aug-2013
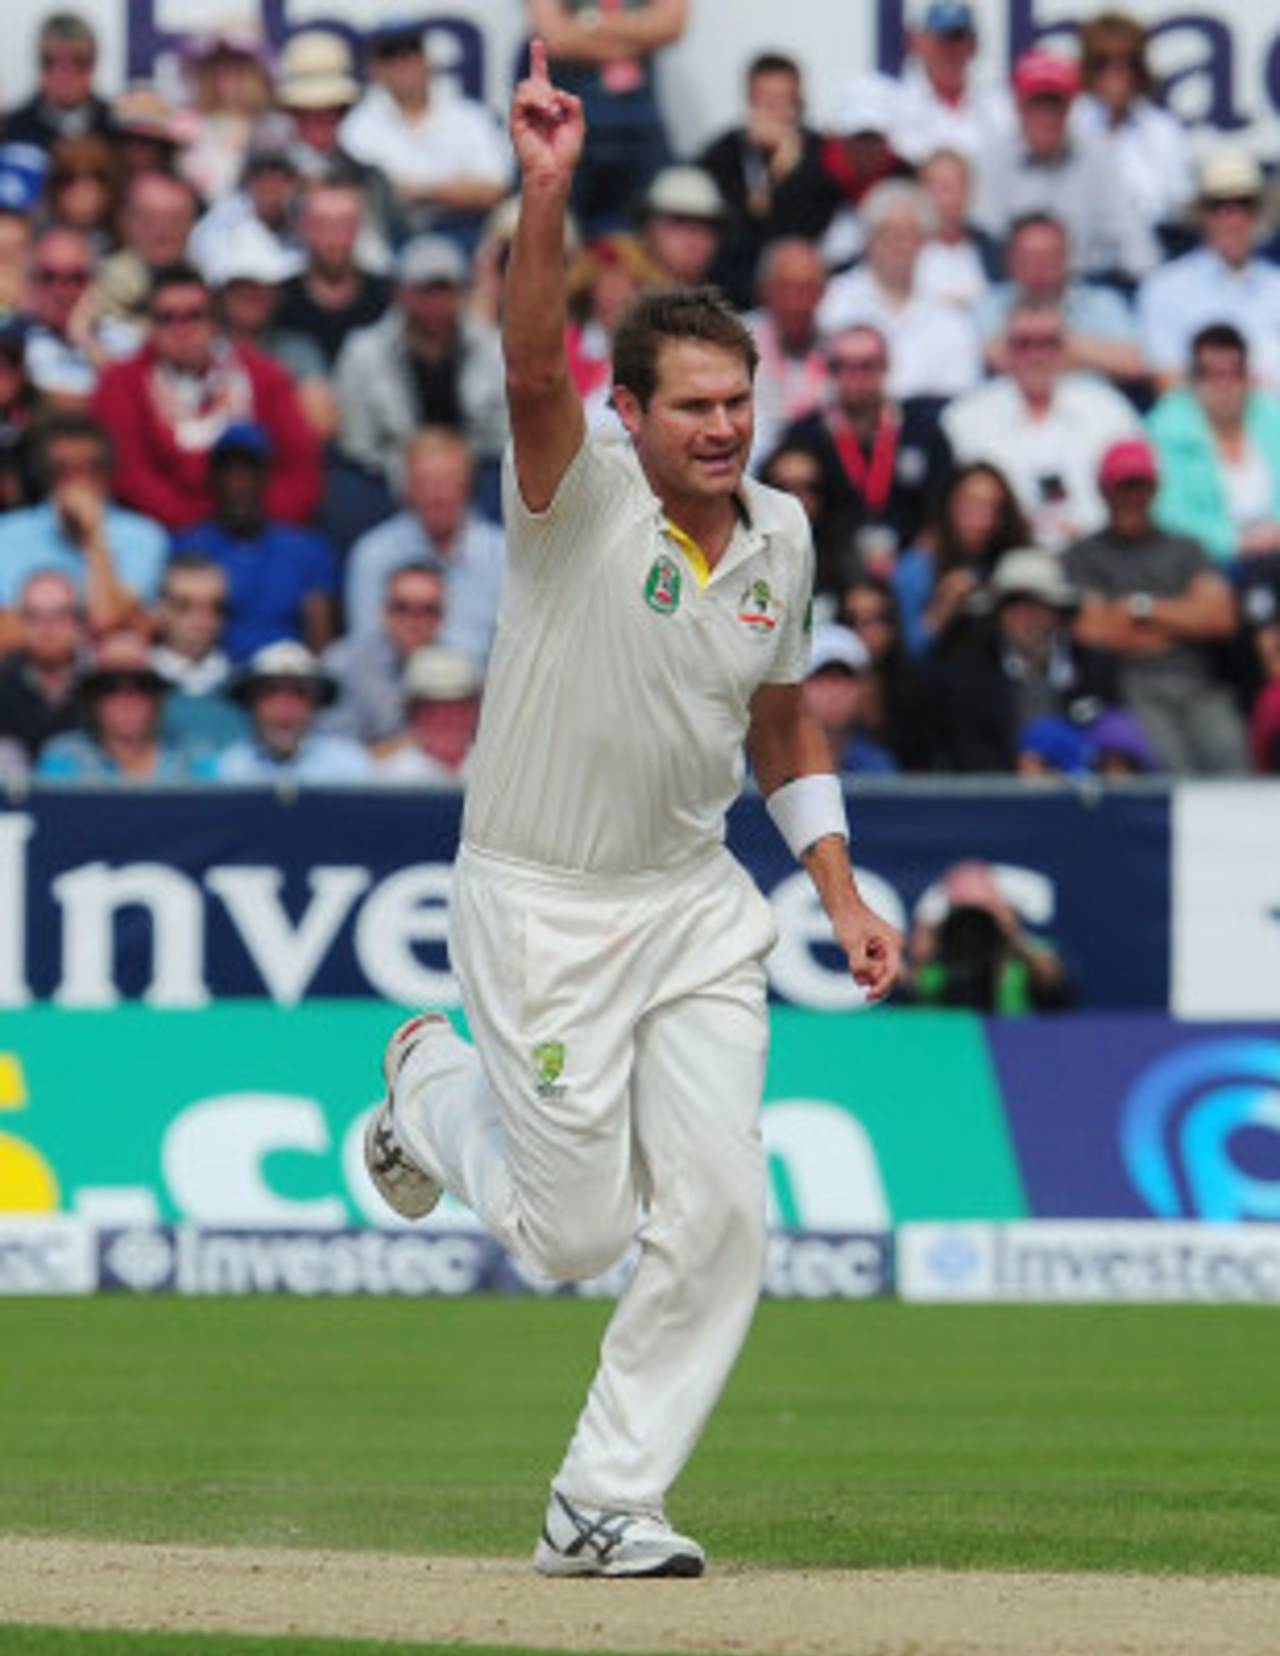
Ryan Harris was more than a handful for all the England top-order batsmen, but he still ended up on the losing side • PA Photos
It isn't often that the best bowler of a series emerges from a team that has lost 3-0, but that happened in the 2013 Ashes, as Ryan Harris was arguably the most potent bowler from either team. Graeme Swann was the leading wicket-taker with 26, but Harris, who missed a Test, averaged 19.58 for his 24 wickets compared to Swann's average of 29.03. So strong was Harris' performance that he has jumped up to No. 5 in the ICC rankings for Test bowlers, which is the highest among current Australian bowlers.
Not only was Harris among the wickets, he also regularly got the better of England's top order - only six of his 24 wickets were those of lower-order batsmen. He dismissed Jonathan Trott and Joe Root four times each, with the two batsmen averaging 12 and 9.50 against him, while Cook fell three times at an average of 23.67. Ian Bell, the best batsman of the series, averaged 28 against him, scoring only 56 from 158 balls. Even without giving Harris extra points for getting the top batsmen out, his series average of 19.58 is still one of the best by a bowler from the losing team in an Ashes series.
Among bowlers who have sent down at least 150 overs in a losing Ashes campaign, Harris' average ranks seventh. Only one of the performances in the top six have come since 1955, and that's also on top of this list, and is the second-best for a bowler in any Ashes series, from either the winning or losing team.
Rodney Hogg's haul of 41 wickets in his debut series in the 1978-79 Ashes has been bettered by only four bowlers in any series in Test history; one of those was also in an Ashes series defeat - Terry Alderman's 42 wickets in 1981. What's so stunning about Hogg's series stats is that despite taking so many wickets at an incredible average of 12.85, Australia still went on to lose the series 5-1. That was one of the series in which Australia's squad was badly hit by the Packer exodus, and most of the replacements - save Hogg - couldn't measure up. Among the Australian batsmen who played more than three Tests, the highest average was Graham Yallop's 32.58, while Kim Hughes averaged 28.75. It was a series dominated by the bowlers of both teams: no bowler from the England team averaged more than 25. (Ironically, despite having such a potent fast bowler in their line-up, Australia opted to open the bowling with an old ball and two spinners in the last innings of the series, in Sydney; it was another matter, though, that England needed only 34 to win the game.)
The next five entries after Hogg in the table below are all from before 1955, with the most recent being Ray Lindwall's effort in the 1953 Ashes in England, when his 26 wickets at 18.84 couldn't prevent a 1-0 series defeat. Lindwall clearly suffered from lack of support, with no other Australian bowler taking more than ten wickets. A couple of years before that, England's Alec Bedser was a similar hero in defeat, as his 30 wickets at 16.06 couldn't prevent a 4-1 series rout.
Among the more recent such cases was Shane Warne's 40 wickets in 2005, when England won an epic series 2-1. Even that haul was two short of Alderman's tally in 1981, a series remembered for Ian Botham's immortal feats. Despite Alderman's 42 wickets and Dennis Lillee's 39, Australia lost the series 3-1.
| Bowler | Series | Tests | Wickets | Average | Strike rate | 5WI/ 10WM | Series result |
| Rodney Hogg | 1978-79, in Aus | 6 | 41 | 12.85 | 42.4 | 5/ 2 | Eng 5-1 |
| Alec Bedser | 1950-51, in Aus | 5 | 30 | 16.06 | 52.0 | 2/ 1 | Aus 4-1 |
| Hugh Trumble | 1903-04, in Aus | 4 | 24 | 16.58 | 49.9 | 2/ 0 | Eng 3-2 |
| George Lohmann | 1891-92, in Aus | 3 | 16 | 18.06 | 70.6 | 1/ 1 | Aus 2-1 |
| Ray Lindwall | 1953, in Eng | 5 | 26 | 18.84 | 55.5 | 3/ 0 | Eng 1-0 |
| Charlie Turner | 1894-95, in Aus | 3 | 18 | 19.38 | 62.3 | 1/ 0 | Eng 3-2 |
| Ryan Harris | 2013, in Eng | 4 | 24 | 19.58 | 40.5 | 2/ 0 | Eng 3-0 |
| Shane Warne | 2005, in Eng | 5 | 40 | 19.92 | 37.9 | 3/ 2 | Eng 2-1 |
| Sydney Barnes | 1909, in Eng | 3 | 17 | 20.00 | 54.8 | 2/ 0 | Aus 2-1 |
| John Gunn | 1901-02, in Aus | 5 | 17 | 21.17 | 56.6 | 1/ 0 | Aus 4-1 |
| Jim Laker | 1958-59, in Aus | 4 | 15 | 21.20 | 68.1 | 1/ 0 | Aus 4-0 |
| Darren Gough | 1994-95, in Aus | 3 | 20 | 21.25 | 45.8 | 1/ 0 | Aus 3-1 |
| Terry Alderman | 1981, in Eng | 6 | 42 | 21.26 | 46.4 | 4/ 0 | Eng 3-1 |
None of the Australian batsmen came anywhere close to replicating Harris' performances this summer, but their current captain, Michael Clarke, did something similar in 2009, scoring 448 runs at 64 even as Australia lost the series 2-1. When Australia got walloped 3-1 the next season at home, Michael Hussey played a similar role, scoring 570 at 63.33 in a series in which no other Australian batsman managed 450. Twenty-four years before Clarke's heroics in England, Allan Border had played a lone hand in 1985, leading the team and scoring 597 runs at 66.33. With David Gower, the England captain, scoring 732 runs in that series, the captains' aggregate was 1329, the highest ever in a Test series.
England's most recent such one-man act was in 2002-03 by Michael Vaughan, in a series in which there was very little else of note for the team apart from Vaughan's sublime batting. He aggregated 633 runs at 63.30; the next-best aggregate for England was Nasser Hussain's 382.
The first six such instances in the table below are all from before 1965. Australia's Charles Macartney heads the list, scoring 473 runs in the 1926 Ashes at an average of 94.60 in a series Australia lost 1-0.
| Batsman | Series | Tests | Runs | Average | 100s/ 50s | Series result |
| Charles Macartney | 1926, in Eng | 5 | 473 | 94.60 | 3/ 0 | Eng 1-0 |
| Len Hutton | 1950-51, in Aus | 5 | 533 | 88.83 | 1/ 4 | Aus 4-1 |
| Herbert Sutcliffe | 1924-25, in Aus | 5 | 734 | 81.55 | 4/ 2 | Aus 4-1 |
| Ken Barrington | 1964, in Eng | 5 | 531 | 75.85 | 1/ 2 | Aus 1-0 |
| Tom Hayward | 1899, in Eng | 5 | 413 | 68.83 | 2/ 1 | Aus 1-0 |
| Maurice Leyland | 1934, in Eng | 5 | 478 | 68.28 | 3/ 0 | Aus 2-1 |
| Allan Border | 1985, in Eng | 6 | 597 | 66.33 | 2/ 1 | Eng 3-1 |
| Michael Clarke | 2009, in Eng | 5 | 448 | 64.00 | 2/ 2 | Eng 2-1 |
| Victor Trumper | 1903-04, in Aus | 5 | 574 | 63.77 | 2/ 3 | Eng 3-2 |
| Jack Hobbs | 1924-25, in Eng | 5 | 573 | 63.66 | 3/ 2 | Aus 4-1 |
| Michael Hussey | 2010-11, in Aus | 5 | 570 | 63.33 | 2/ 3 | Eng 3-1 |
| Michael Vaughan | 2002-03, in Aus | 5 | 633 | 63.30 | 3/ 0 | Aus 4-1 |
None of the Australian batsmen managed an average of 50 in the 2013 Ashes, but England had one outstanding star batting star in Ian Bell, who scored 562 runs at 62.44; he was the only player from either team to average more than 50. It's been quite a transformation for Bell against Australia: in his first three series against them, he averaged 17.10 (171 runs from ten innings in 2005), 33.10 (331 runs from ten innings in 2006-07) and 28 (140 from five innings in 2009). Add that up, and you get 642 runs from 25 innings, at 25.68, with a highest score of 87.
In his last two series against Australia, though, Bell has more than made up for those failures, averaging more than 62 in each of them. That means Bell is the only England batsman to feature twice in the list of top ten England batsmen with highest Ashes averages since 1970 (with a cut-off of five Tests). This, from a player who supposedly didn't have a stomach for a battle. Clearly, things have changed significantly for Ian Bell the Test batsman in the last three years.
| Batsman | Series | Tests | Runs | Average | 100s/ 50s | Series result |
| Alastair Cook | 2010-11, in Aus | 5 | 766 | 127.67 | 3/ 2 | Eng 3-1 |
| Geoff Boycott | 1970-71, in Aus | 5 | 657 | 93.85 | 2/ 5 | Eng 2-0 |
| Jonathan Trott | 2010-11, in Aus | 5 | 445 | 89.00 | 2/ 1 | Eng 3-1 |
| Mike Gatting | 1985, in Eng | 6 | 527 | 87.83 | 2/ 3 | Eng 3-1 |
| David Gower | 1985, in Eng | 6 | 732 | 81.33 | 3/ 1 | Eng 3-1 |
| John Edrich | 1970-71, in Aus | 6 | 648 | 72.00 | 2/ 4 | Eng 2-0 |
| Chris Broad | 1986-87, in Aus | 5 | 487 | 69.57 | 3/ 0 | Eng 2-1 |
| Ian Bell | 2010-11, in Aus | 5 | 329 | 65.80 | 1/ 3 | Eng 3-1 |
| Michael Vaughan | 2002-03, in Aus | 5 | 633 | 63.30 | 3/ 0 | Aus 4-1 |
| Ian Bell | 2013, in Eng | 5 | 562 | 62.44 | 3/ 2 | Eng 3-0 |
S Rajesh is stats editor of ESPNcricinfo. Follow him on Twitter