Mr Inconsistents
There is no doubting the batting talent of Shaun Marsh and KL Rahul, but both have been plagued by inconsistency in their Test careers so far
S Rajesh
Feb 24, 2017, 2:15 AM
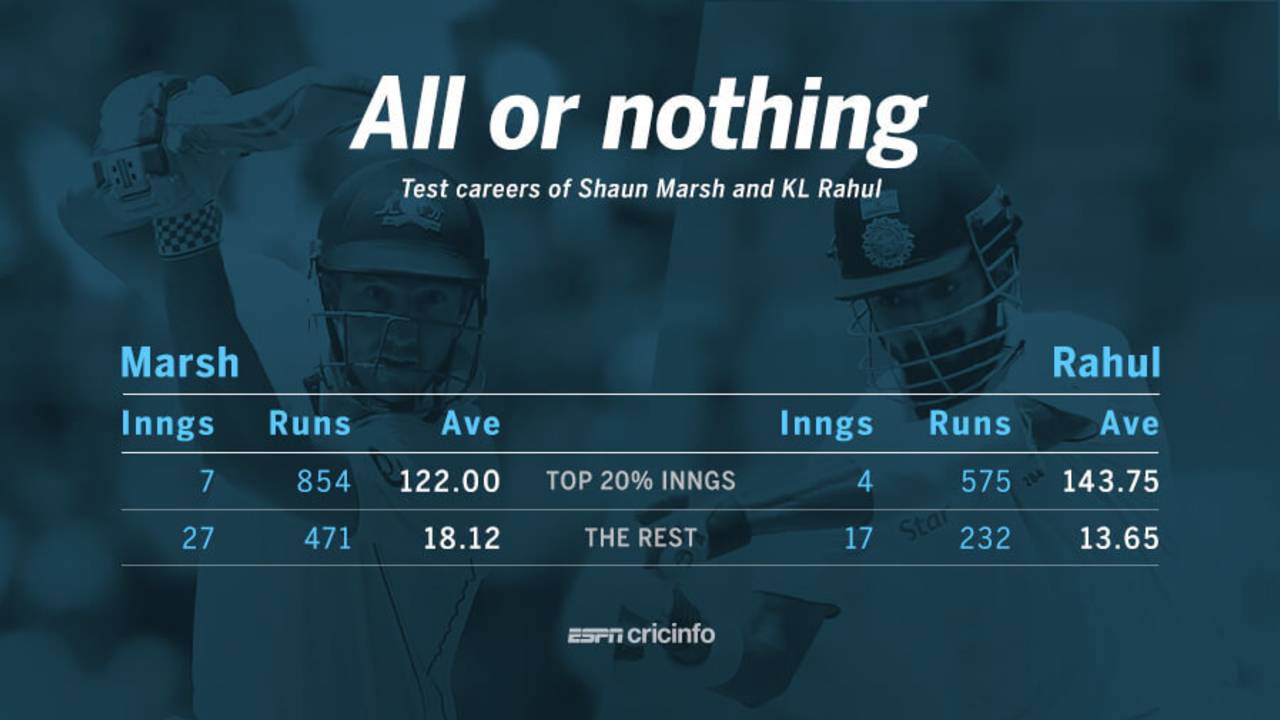
For both Marsh and Rahul, the top 20% of their Test innings account for most of their runs • ESPNcricinfo Ltd
All numbers exclude the ongoing Test between India and Australia in Pune.
When they are at their best, both Shaun Marsh and KL Rahul look a million dollars: their strokeplay is elegant and effortless, they have all the shots in the book and then some, and they generally make batting look easy. Both have adjusted to different formats quite well, scoring heavily in T20s and in Test cricket. However, both are still striving to prove they can be consistent Test batsmen, and that they can combine grace and elegance with runs on a regular basis.
So far, Test cricket has been a mixed bag for the two. They have both notched up some big scores - Marsh's highest Test score is 182, while Rahul made 199 earlier this season - but both have also developed a habit of making a string of low scores between those big ones.
Marsh's blow-hot, blow-cold career has been particularly frustrating for Australia for several years. He started in Tests with scores of 141 and 81 in difficult conditions in Sri Lanka in 2011, but then, in the home season that followed, when the rest of the Australia top order feasted on India's feeble attack, Marsh had a horror series, with scores of 0, 3, 0, 11, 3, 0 - 17 runs in six innings. Similarly, an outstanding hundred in Centurion in 2014 was followed by a pair in the next Test. To be fair to Marsh, he has been more consistent recently, with two hundreds and a fifty in his last five innings, but then injuries have struck at inopportune moments to rob his career of momentum.
Rahul is much younger - 24 to Marsh's 33 - and is in the early stages of his international career. That means he is allowed more time to find his feet, and is allowed more failures, but for a player of his ability, he too has had far too many failures: he has been dismissed for ten runs or fewer in 11 out of 21 innings.
A split of their careers - looking at their top 20% innings and the rest - tells the story of their up-and-down performances in Tests so far. In the top 20% of their innings, both Marsh and Rahul average more than 120, with Rahul averaging almost 144, thanks to scores of 199, 158, 110 and 108. In the remaining 80% of their innings, though, their average drops to less than 20; Rahul's average is less than 14. In terms of aggregates, Rahul has, in his top 20% innings, scored almost 2.5 times as many runs as he has in the remaining innings, while for Marsh the ratio is 1.81.
| Shaun Marsh | KL Rahul | |||||||
| Inngs | Runs | Ave | % runs | Inngs | Runs | Ave | % runs | |
| Top 20% inngs | 7 | 854 | 122.00 | 64.45 | 4 | 575 | 143.75 | 71.25 |
| The rest | 27 | 471 | 18.12 | 35.55 | 17 | 232 | 13.65 | 28.75 |
| Career | 34 | 1325 | 40.15 | 100 | 21 | 807 | 38.42 | 100 |
| Batsman | Runs - top 20% inngs | Remaining inngs | Ratio |
| Shaun Marsh | 854 | 471 | 1.81 |
| KL Rahul | 575 | 232 | 2.48 |
For the top players, averaging more than 100 in the top 20% of their innings isn't uncommon. In the top 20% of their innings, Virat Kohli, Steven Smith, Joe Root and Kane Williamson all score more than 120 runs per innings. (These aren't averages, as not-outs are not excluded from the number of innings batted.) On that front, both Marsh and Rahul are right up there with the best.
Where these stars score over Marsh and Rahul, though, is in managing the remaining 80% of their batting performances. While Marsh and Rahul have averaged less than 20 in those innings, Smith, Kohli, Root and Williamson have all averaged in excess of 27, with Smith's average touching 34. (In the top 20% innings, not-outs have been included as innings batted, while in the lower 80%, not-outs have been excluded, to omit instances of batsmen being not out for low scores. Even when not-outs are included, the runs-per-innings figure is still fairly healthy for all four - 29.81 for Smith, 25.97 for Kohli, 26.95 for Root, and 26.12 for Williamson.)
| Top 20% inngs | The rest | ||||||
| Batsman | Inngs | Runs | RpI | Inngs | Runs | Ave | Runs ratio |
| Steven Smith | 18 | 2546 | 141.44 | 74 | 2206 | 33.93 | 1.15 |
| Virat Kohli | 18 | 2529 | 140.50 | 74 | 1922 | 27.85 | 1.32 |
| Joe Root | 20 | 2492 | 124.60 | 78 | 2102 | 29.60 | 1.19 |
| Kane Williamson | 21 | 2587 | 123.19 | 85 | 2220 | 27.75 | 1.17 |
The median values for these batsmen is another good indicator of consistency, or the lack of it. Rahul has played 21 innings in Tests, and his 11th-highest score in these innings is 10; that means he has scored ten or more runs in only half the innings he has played, while in the other half he has made ten or fewer runs. Similarly for Marsh, the median score (which is the average of his 17th and 18th-highest scores, in 34 innings), is 17.5.
These are incredibly low median scores for top-order batsmen, and are illustrative of high failure rates: Marsh, for instance, has seven ducks in 34 innings, while Root has three in 98. The medians for the four other players discussed in this piece are all in excess of 28; in fact, the medians for Kohli, Root and Williamson are all within a range of 0.5 of each other.
These four players all have averages of more than 50, but perhaps more illustrative would be to compare Marsh and Rahul's median numbers with that of Murali Vijay, Rahul's opening partner in the Indian team. His average isn't much better than Rahul's, and is very close to that of Marsh, but his median score is 26, compared with Rahul's 10 and Marsh's 17.5. Incidentally, David Warner's median score is 29 as well.
| Batsman | Inngs | Average | Median score |
| Steven Smith | 92 | 60.15 | 33.50 |
| Joe Root | 98 | 52.80 | 29.00 |
| Kane Williamson | 106 | 50.07 | 29.00 |
| Virat Kohli | 92 | 51.75 | 28.50 |
| Batsman | Inngs | Average | Median score |
| KL Rahul | 21 | 38.42 | 10.00 |
| Shaun Marsh | 34 | 40.15 | 17.50 |
| Murali Vijay | 82 | 40.67 | 26.00 |
| David Warner | 111 | 49.16 | 29.00 |
These are early days in international cricket for Rahul, but for both him and Marsh, greater consistency will be crucial if they are to cement their places in the Test line-ups for their countries.
S Rajesh is stats editor of ESPNcricinfo. @rajeshstats