Spin, top-order batting make the difference
In the strongest test of their ability to play spin, Australia's inexperienced top-order batsmen were found wanting in alien conditions
Madhusudhan Ramakrishnan
25-Mar-2013
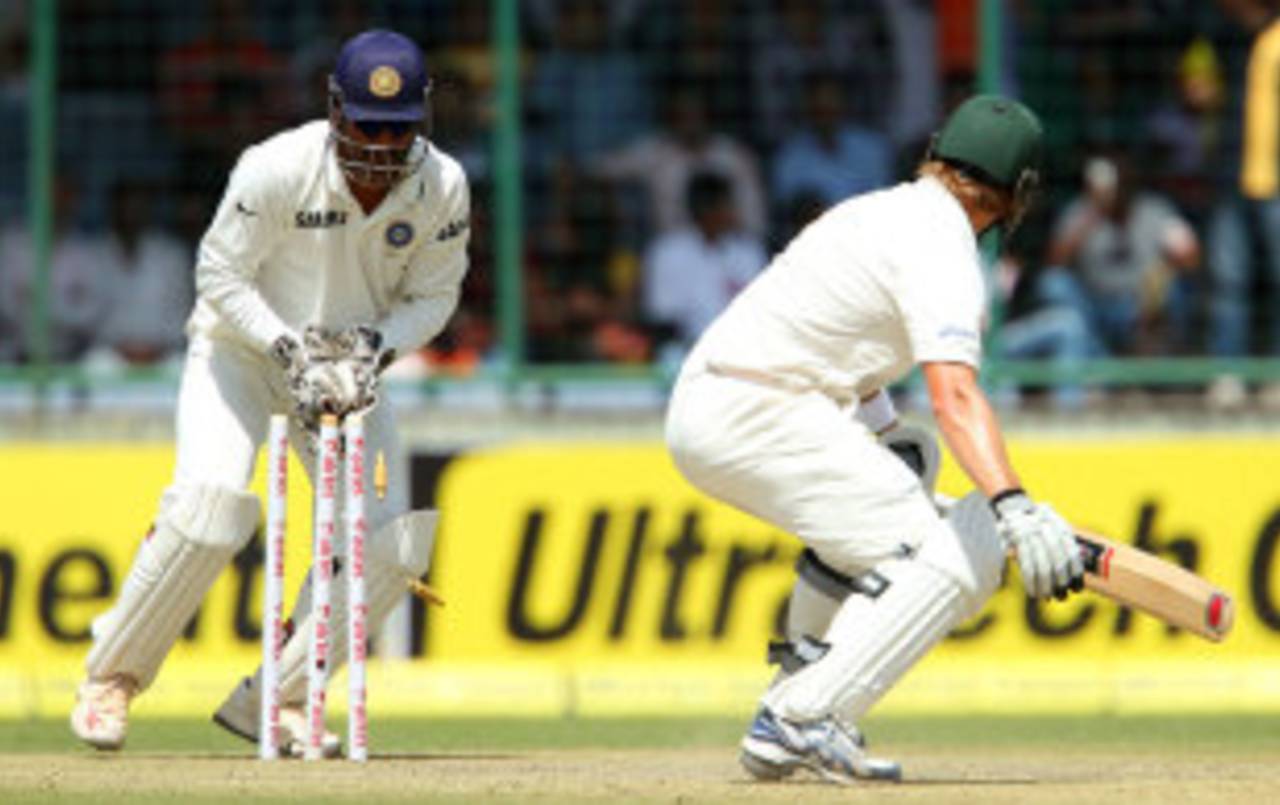
Shane Watson, who averaged just 16.50, was one of the major failures among Australia's top-order batsmen • BCCI
When Australia toured India in 2001, they were a world-beating team on a 15-match winning streak. In that series, India's fortunes were completely turned around by a fantastic partnership between VVS Laxman and Rahul Dravid in Kolkata. In sharp contrast, the team that toured this time round was inexperienced and lacked quality. Still, halfway through the first Test in Chennai, they were extremely competitive and raised visions of a win until MS Dhoni altered the course of the game with a brilliant double-century. This effort virtually ended the visitors' challenge. Australia were crushed by an innings in the next Test and beaten convincingly in the third and fourth Tests too. This was the first time that Australia had been whitewashed in a series (three or more matches) since 1982-83 when Pakistan beat them 3-0. The whitewash was also the first achieved by India since their 3-0 home series win against Sri Lanka in 1994. India, who lost 4-0 in England and Australia, joined Australia, West Indies, South Africa and England on the list of teams who have been on the winning and losing side of series whitewashes (four-plus match series).
In 2011-12, India travelled to Australia after a 4-0 drubbing in England. The first Test at the MCG proved close until the end of day four, before India fell away, losing by 122 runs. The next three Tests were forgettable for India as Australia won two by an innings and one by 298 runs. India's batting average in the series was just 23.08 as compared to Australia's 51.56. In the recent series in India, the stats were completely reversed. Australia's batting woes against spin were thoroughly exposed as the visitors managed to average just 25.89. India, in comparison, averaged 43.80. The home dominance of the two teams can be further gauged by comparing the number of centuries scored. While India managed just one century (and 10 fifties) on the 2011-12 tour, Australia were able to score just one century (and 12 fifties) in the recently-concluded series. Australia had six century stands in the home series and three in India. Remarkably, India had the exact same number of partnerships in the home and away series (six and three respectively). As expected, the pace bowlers were the key to Australia's success in the home series, picking up 71 of the 79 wickets to fall. In India, however, the home spinners were responsible for picking up majority of the wickets (65 out of 78).
| Series | Avg (Aus/Ind) | Avg diff (Aus) | 100/50 (Aus) | 100/50 (Ind) | 5WI(Aus/Ind) | 100 stands (Aus/Ind) | (Pace/spin wkts) Aus | (Pace/spin wkts Ind) |
| India in Australia, 2011-12 | 51.56/23.08 | 28.48 | 6/6 | 1/10 | 3/1 | 6/3 | 71/8 | 35/10 |
| Australia in India, 2012-13 | 25.89/43.80 | -17.91 | 1/12 | 6/5 | 3/5 | 3/6 | 22/27 | 13/65 |
Perhaps the biggest difference between the two teams in the end was the ability of the Indian batsmen to stitch together crucial, match-winning partnerships. In the first Test in Chennai, India were eight down with a lead of just 26 runs, before Dhoni and Bhuvaneshwar Kumar combined to take the game away from Australia with a century stand for the ninth wicket. The second Test in Hyderabad was all about the massive 370-run second-wicket stand between M Vijay and Cheteshwar Pujara. Shikhar Dhawan's superb debut century set up India's first innings in Mohali, as he and Vijay were involved in a 289-run opening stand which deflated the Australian attack. In contrast, the Australian top order batsmen struggled to post effective partnerships, and were more often than not rescued by late-order efforts.
With both David Warner and Ed Cowan ending with a below-par series performance, Australia's average for the first wicket was just 40.50. India, on the other hand, put up a much better show (average 71.71) primarily because of the successful run of Vijay, who ended as the highest run-getter in the series. Pujara's top form also meant that India were well ahead in terms of the average second-wicket partnership. While the average fourth-wicket stand for both teams was not very high, India ended with a far better average for the fifth-wicket partnership. The lower-order partnerships (8-10) were extremely productive for Australia - the last three wickets aggregated 639 runs with six fifty-plus partnerships.
| Partnership wicket | Australia (Runs/avg) | India (Runs/avg) | Australia (100/50 stands) | India (100/50 stands) |
| 1 | 324/40.50 | 502/71.71 | 1/2 | 2/0 |
| 2 | 148/18.50 | 532/76.00 | 0/1 | 2/0 |
| 3 | 204/25.50 | 276/46.00 | 0/1 | 0/2 |
| 4 | 180/22.50 | 161/26.83 | 0/0 | 0/1 |
| 5 | 270/33.75 | 253/63.25 | 1/0 | 1/1 |
| 6 | 227/28.37 | 106/26.50 | 1/0 | 0/0 |
| 7 | 54/6.75 | 56/14.00 | 0/0 | 0/0 |
| 8-10 | 639/27.78 | 304/25.33 | 0/6 | 1/1 |
Australia's top-order (1-7) batsmen ended the series with an average of 27.40. This is their sixth-lowest average in a series of four or matches since 1970. India's openers scored 806 runs at an average of 62 with three centuries. In contrast, Australia's openers managed just 438 runs at an average of 27.37 without a single century. Hughes and Watson had a very ordinary run, compounding Australia's woes at No. 3. For India, Pujara stood up both at No. 3 (first three Tests) and as an opener in the final Test when he scored twin half-centuries. Tendulkar managed just one half-century and averaged 32 at No. 4. Even so, his performance was significantly better than Australia's No. 4 batsmen, who managed just 90 runs at 11.25. Clarke's consistency at No.5 was one of the few highs for Australia in an otherwise forgettable series. Dhoni ensured that the No. 6 stats were dominated completely by the hosts. Although Australia dominated the lower-order (8-11) numbers, they were left rueing the lack of consistency among the top-order batsmen.
| Batting position | India (Runs/avg) | India (100/50) | Australia (Runs/avg) | Australia (100/50) |
| 1-2 | 806/62.00 | 3/3 | 438/27.37 | 0/3 |
| 3 | 333/55.50 | 1/0 | 186/23.25 | 0/1 |
| 4 | 192/32.00 | 0/1 | 90/11.25 | 0/0 |
| 5 | 234/58.50 | 1/1 | 429/53.62 | 1/2 |
| 6 | 316/79.00 | 1/0 | 151/18.87 | 0/1 |
| 7 | 77/19.25 | 0/0 | 213/30.42 | 0/2 |
| 8 | 20/5.00 | 0/0 | 31/3.87 | 0/0 |
| 9 | 43/14.33 | 0/0 | 247/30.87 | 0/3 |
| 10-11 | 55/9.16 | 0/0 | 160/20.00 | 0/0 |
Before the series started, it was evident that Australia's fortunes firmly rested on their ability to play spin. England, who toured India recently, struggled to come to grips in the first Test, but picked up their game in the next three Tests to win the series 2-1. However, Australia had very little experience to fall back on. Only Clarke and Steven Smith (in the last two Tests) demonstrated the necessary footwork and consistency against spin. Phil Hughes was all at sea in the first two Tests, before turning it around in Mohali and Delhi. The Australian right-hand batsmen fared quite well against right-arm spinners (average 30.25) and managed to score at a decent clip (2.81). Against left-arm spin, however (Ravindra Jadeja in particular), the right-hand batsmen struggled, averaging just 19.65 (scoring rate 2.11). The stats are very similar for left-hand batsmen against right-arm spinners; the right-arm spinners picked up 22 wickets at an average of 19.36. Left-hand batsmen fared slightly better against left-arm spinners averaging 24.00 and scoring at a run-rate of 2.80.
| Bowler type | Batsman type | Wickets | Average | Econ rate | Boundary % |
| Right-arm spin | Right-hand bat | 12 | 30.25 | 2.81 | 44.62 |
| Left-arm spin | Right-hand bat | 20 | 19.65 | 2.11 | 50.38 |
| Right-arm spin | Left-hand bat | 22 | 19.36 | 2.14 | 52.58 |
| Left-arm spin | Left-hand bat | 11 | 24.00 | 2.80 | 37.12 |
One of the highlights of the series was Jadeja's success against Clarke, one of Australia's best players of spin. Jadeja dismissed Clarke five times in six innings, while conceding just 72 runs (average 14.40). Jadeja also had a great run against Glenn Maxwell, dismissing the aggressive batsman three times (average 3.33). R Ashwin, who ended as the highest wicket-taker in the series, continued his good show against left-handers, dismissing Hughes and Cowan on five and four occasions respectively. While Cowan managed an average of 21.00 (56.75 balls per dismissal), Hughes had a terrible time averaging just 7.80 (35.80 balls per dismissal).
Nathan Lyon, who finished with nine wickets in the final Test, dismissed Sachin Tendulkar and Virat Kohli three times each, including getting the two batsmen lbw in both innings of the final match. Lyon however struggled against Dhoni, who hit him for 127 runs off 109 balls (run-rate 6.99) without being dismissed even once. Clarke tasted success against Ashwin, scoring 74 runs (scoring rate 4.18), while being dismissed only once.
| Batsman | Bowler | Runs | Dismissals | Average | Balls per dismissal | Scoring rate |
| Michael Clarke | Ravindra Jadeja | 72 | 5 | 14.40 | 38.00 | 2.27 |
| Phil Hughes | R Ashwin | 39 | 5 | 7.80 | 35.80 | 1.30 |
| Ed Cowan | R Ashwin | 84 | 4 | 21.00 | 56.75 | 2.22 |
| Glenn Maxwell | Ravindra Jadeja | 10 | 3 | 3.33 | 12.66 | 1.57 |
| Sachin Tendulkar | Nathan Lyon | 76 | 3 | 25.33 | 35.66 | 4.26 |
| Virat Kohli | Nathan Lyon | 75 | 3 | 25.00 | 41.33 | 3.62 |
| Michael Clarke | R Ashwin | 74 | 1 | 74.00 | 106.00 | 4.18 |
| MS Dhoni | Nathan Lyon | 127 | 0 | - | - | 6.99 |
Madhusudhan Ramakrishnan is a sub-editor (stats) at ESPNcricinfo