An explainer on the parameters used to devise the ratings for best ODI batting performances of all time
Pitch quality, bowling quality, importance of match and more are taken into consideration
Anantha Narayanan
May 18, 2019, 4:44 AM
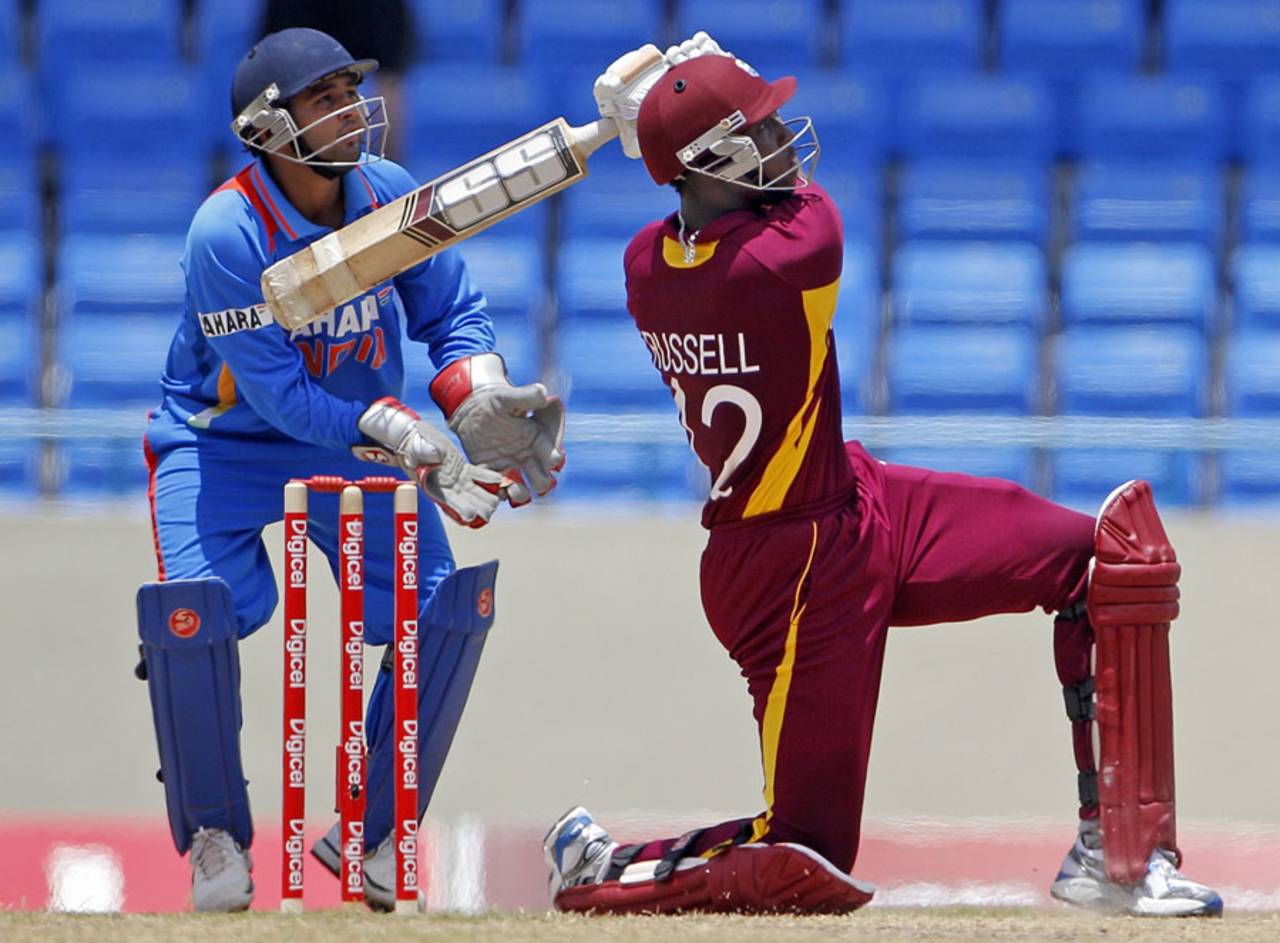
Against India in Antigua in 2011, Andre Russell took West Indies from 96 for 7 to 225, smashing an unbeaten 62-ball 92 • Associated Press
Runs scored (20%)
This is the base parameter. The batsman has to score runs to be of any use to the team. However, care has been taken to ensure that this does not become too significant and result in a bunch of big scores dominating the top of the rankings table. This is ensured by limiting the value to a maximum of 20 points - for a score of 200-plus runs. The runs scored provide the linear base for this parameter. A factor based on the relative strengths of the teams is also applied to reduce or increase the base points. It is clear that Gary Kirsten's 188 against UAE has to be devalued relative to Kevin O'Brien's 113 against England.
This is the base parameter. The batsman has to score runs to be of any use to the team. However, care has been taken to ensure that this does not become too significant and result in a bunch of big scores dominating the top of the rankings table. This is ensured by limiting the value to a maximum of 20 points - for a score of 200-plus runs. The runs scored provide the linear base for this parameter. A factor based on the relative strengths of the teams is also applied to reduce or increase the base points. It is clear that Gary Kirsten's 188 against UAE has to be devalued relative to Kevin O'Brien's 113 against England.
The recent 170-plus scores by John Campbell and Shai Hope have garnered just over 60 points each in the rankings. On the other hand, Ben Foakes' match-winning 61 gets about 55 points. This indicates that the score plays only a minor part in the overall ratings process.
Six of the eight 200-plus scores share the top billing on this parameter. The other two were scored against Zimbabwe.
Absolute SR
This is one of the purest parameters, in that the absolute value of the strike rate is used with no adjustments whatsoever. Also, there is no relative measure of computation.
This is one of the purest parameters, in that the absolute value of the strike rate is used with no adjustments whatsoever. Also, there is no relative measure of computation.
If we ignore innings such as 23 in five balls, 24 in six and so on, the highest-rated innings in this measure is AB de Villiers' 149 in 44 balls against West Indies in 2015, with a strike rate of 343.
IVI (Support, Relative SR, %Team Score)
Inarguably this is the most important parameter since it encompasses three important elements related to the innings. These are the "support received", the "relative scoring rate" and the "percentage of team score". The weights are assigned in the order of mention.
Inarguably this is the most important parameter since it encompasses three important elements related to the innings. These are the "support received", the "relative scoring rate" and the "percentage of team score". The weights are assigned in the order of mention.
Kapil Dev's 175 against Zimbabwe in the 1983 World Cup tops in this regard. Kapil's innings had minimal support, was well over 60% of the team score, and the scoring rate differential was huge. Viv Richards' 189 not out against England in 1984 is very close behind, separated in the second decimal point.
Bowling Quality
This reflects the quality of bowlers who took the field for that particular match. The CTD (Career-to-date) values are used to determine the Bowling Quality. Thus, this parameter is a true reflection of the quality of bowling faced by the batsman. This also means that the rating values stay firm as new matches are played.
This reflects the quality of bowlers who took the field for that particular match. The CTD (Career-to-date) values are used to determine the Bowling Quality. Thus, this parameter is a true reflection of the quality of bowling faced by the batsman. This also means that the rating values stay firm as new matches are played.
Mohsin Khan, while scoring 70 in the 1983 World Cup semi-final, faced the toughest bowling attack ever: Andy Roberts, Joel Garner, Malcolm Marshall and Michael Holding.
Pitch Quality
This is based on the RpW (Runs per Wicket) of the particular match. There is no use going into any history since the RpW values move like yo-yos in this regard across time.
This is based on the RpW (Runs per Wicket) of the particular match. There is no use going into any history since the RpW values move like yo-yos in this regard across time.
Saeed Anwar's 42 not out against India in Gujranwala in 1989 secures the highest points in this measure. The scores were 87 for 9 and 80 for 9, leading to a RpW of 9.3. Noor Ali Zadran's 63 in the match between Afghanistan and Zimbabwe during 2015 is close behind. The match RpW was a mere 10.3.
Innings status
This measure determines the status of the game at the time of the batsman's entry by using the target, the percentage of target remaining to win, and the resources still available. For the first innings, the target is fixed based on the period concerned. The target is the Batting Par Score for the period. This value ranges from 260 to 280. This is the score which gives the batting team a 66.7% chance of success. For more details on this, please refer to my recent article on redefining par scores in ODIs. However, for the second innings, the targets range from 36 to 482 and the measure takes into account the target ahead, so the target is straightforward.
This measure determines the status of the game at the time of the batsman's entry by using the target, the percentage of target remaining to win, and the resources still available. For the first innings, the target is fixed based on the period concerned. The target is the Batting Par Score for the period. This value ranges from 260 to 280. This is the score which gives the batting team a 66.7% chance of success. For more details on this, please refer to my recent article on redefining par scores in ODIs. However, for the second innings, the targets range from 36 to 482 and the measure takes into account the target ahead, so the target is straightforward.
In Antigua against India in 2011, Andre Russell entered at 96 for 7 and eventually set a target of 274. This precarious position gave him the highest value on this measure. Of course, we have to ignore instances like Phil Eaglestone of Ireland getting in to bat at 94 for 9 while chasing 403 against New Zealand.
Runs with late order
This is a very important measure. It is not too difficult to score runs while in the company of top-order batsmen. However, many matches are won because the set batsman adds invaluable runs with late-order batsmen, from the fall of the sixth wicket onwards.
This is a very important measure. It is not too difficult to score runs while in the company of top-order batsmen. However, many matches are won because the set batsman adds invaluable runs with late-order batsmen, from the fall of the sixth wicket onwards.
Grant Flower, who made 105 not out against Pakistan in Harare in 2002, entered at 13 for 3 and saw the score slump to 41 for 6. He added 169 runs with the tail and took the score to 210. This is the highest-rated innings on this measure, since the percentage of the team score also comes into play. It is of interest to note that Marcus Stoinis added more runs with the late-order batsmen in an ODI against New Zealand in Auckland in 2017, but with a smaller proportion of the team score (referred to in the main article).
Partnerships
The ability to put together partnerships is an important aspect of a batsman's game. A partnership means that a quick fall of another wicket has been avoided. A complex formula is used for this by computing a minimum value based on the team score and the partnerships the batsman was part of. A maximum of four partnerships are considered.
The ability to put together partnerships is an important aspect of a batsman's game. A partnership means that a quick fall of another wicket has been avoided. A complex formula is used for this by computing a minimum value based on the team score and the partnerships the batsman was part of. A maximum of four partnerships are considered.
In his 96 not out against Sri Lanka in Cuttack in 2009, Sachin Tendulkar was a part of four consecutive sizeable partnerships. He gets the maximum points. Just behind him is MS Dhoni - for his 183 not out against Sri Lanka in 2005. Dhoni had four consecutive partnerships, three of which qualified to be valid partnerships.
TS/L/R (Team Strength ratio/Location/Result)
This measure is a combination of three factors: the relative team strengths, the location and the result. In addition, very close results, such as one- or two-wicket wins are considered and the concerned batsmen get additional credit. Close results like under ten-run losses are also rewarded a little bit. Ties carry a lot more credit than no-result matches, since a tie is considered to be a result.
This measure is a combination of three factors: the relative team strengths, the location and the result. In addition, very close results, such as one- or two-wicket wins are considered and the concerned batsmen get additional credit. Close results like under ten-run losses are also rewarded a little bit. Ties carry a lot more credit than no-result matches, since a tie is considered to be a result.
Andre Russell's 64 not out in 40 balls, which helped West Indies get a huge upset win over South Africa in 2015, secured the highest rating points for this measure. The Team Strength differential was huge (71.5 to 58.3) and this was an away win by one wicket.
Match Importance Index
Multiplying factor in the range 95% to 125%. The 11 World Cup finals carry the maximum index value.
Multiplying factor in the range 95% to 125%. The 11 World Cup finals carry the maximum index value.
It is noteworthy that Russell is featured in two of these measures as the best performer.
Overall weights
The overall weights for innings of 50 runs and higher (10417 in total) are given below.
The overall weights for innings of 50 runs and higher (10417 in total) are given below.
Runs: 19.9%
ScRt: 4.9%
IVI: 10.6%
BowQ: 20.5%
PQI: 12.0%
POE: 8.7%
RLO: 0.7% ***
PSI: 5.5%
T/L/R: 17.3%
ScRt: 4.9%
IVI: 10.6%
BowQ: 20.5%
PQI: 12.0%
POE: 8.7%
RLO: 0.7% ***
PSI: 5.5%
T/L/R: 17.3%
***: The "Runs with Late Order" parameter has a value only for 1831 of the innings included above. That accounts only for 18% of the total innings considered. The RLO weight for the 1831 innings works out to 4%.
It should be remembered that the weight of IVI is somewhat low but the real influence is much higher for the higher scores. Also, the "Scoring Rate" factor is spread across two parameters - ScRt and IVI.
Anantha Narayanan has written for ESPNcricinfo and CastrolCricket and worked with a number of companies on their cricket performance ratings-related systems