An incisive look at series "colour"-washes in Test cricket
An in-depth analysis of series sweeps - the most comprehensive Test-series wins
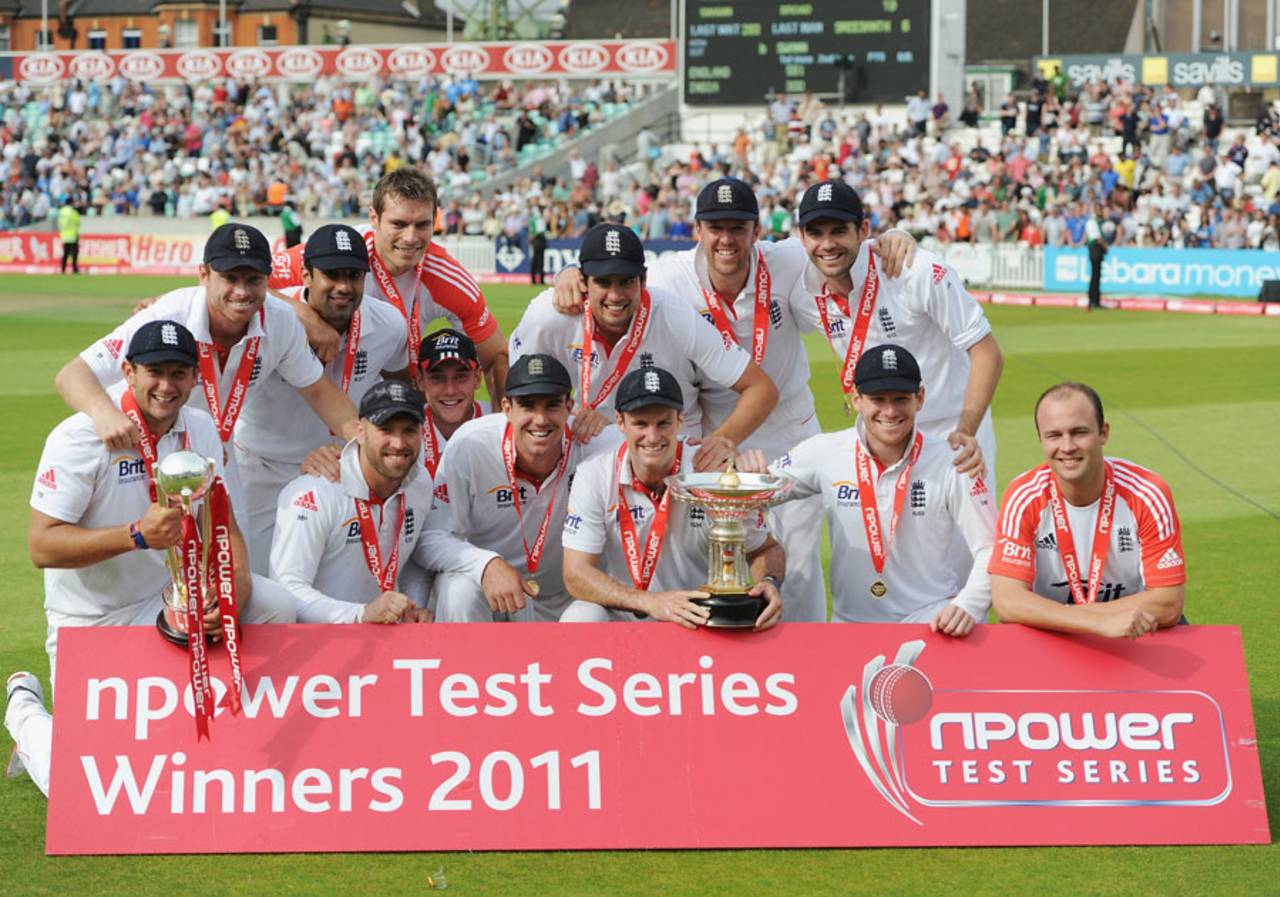
England's 4-0 series win over India is one of the most dominant team performances in Test history • Getty Images
As the recent England-India series unfolded, the win margins became bigger and bigger and by the time the series ended, one started hoping that India would have deemed to have climbed the Mt.Everest if they made England bat again. There were talks of this being India's biggest ever defeat. I had looked beyond that and had a fleeting suspicion that this could indeed be any team's biggest ever defeat.
So I started work on this hypothesis. I have embarked on a complex method of evaluating this and later on, as an additional analysis, linking with team strengths and series location. Let me emphasize that this analysis is based on the results and only results. The scorecard is the only document used. There may be many other factors responsible for the series results, to name a few, injuries, loss of form, non-preparedness, fitness, tiredness, selection issues, non-availability of key players, technical shortcomings et al. However these are outside the scope of this analysis. However it is my considered opinion that these would only have reduced the margin of series loss and match losses. If everything had worked for India, they might still have lost 1-2.
Each match is allotted 100 points. These are further allocated to the two teams based on the results. Not just the results but the numbers behind the results. The points secured by the two teams are averaged for the series. This is a very good indicator of the way teams have performed in the series. This method allows us to understand the difference between two series, both finishing 4-0, but one with very close well-fought matches and the other, like the recently completed one, huge-margin wins. As already explained, the methodology for the analysis is explained at the end.
Now let us look at the results.
I have selected only 4/5/6 Test series for multiple reasons. One is that I have kept the minnows out by this single decision. The other is that I want the teams' winning margins to be achieved over greater number of matches. My apologies to Sri Lanka since most of their series have been kept out. But this cannot be helped.
My surmise was correct. In the 210 4/5/6 match Test series played so far, the England win over India is the most comprehensive and devastating in history of Test cricket. That is what many experts are saying but this is now proved here with hard analytical conclusions. Let me add that there is one 3-Test series which has a wider Win margin than this one. That came in the Sri Lanka-Zimbabwe series, held during 2001. I am now happy that I excluded the 3-Test series from the analysis since I think a win against a weak team should not dilute this analysis.
The slightly better news is that, taken in context, taking into account the relative team strengths and the home advantage for England, this is not the most comprehensive defeat ever but is pipped by the South African white-wash of the 1970 Australians.
Let us look at the tables.
Ser Year Home Away Res # [...Win-margin...]
The first table is ordered by the raw Win-margin value. England won the 4-test series by the widest margin of 80.84-19.96. This is the equivalent of 4 innings wins. There was a huge innings win which compensated for the 196 run margin win. The summary of the top five series is given below.
The second biggest margin was inflicted by South Africa on Australia, during 1931. They were better by just a decimal point.
The third biggest margin was inflicted by South Africa on Australia, during 1970, just before the Apartheid break-down. They were better by nearly 1%. This also indicates the loss to the world cricket through the absence of the wonderful South African team of 1970. Before any one pounces on me let me say, through their own racial segregation policies. The boycott was 100% correct and essential.
The next one is the English whitewash of the 1959 Indian team. However the scores would indicate more of a fight by the weaker 1959 team. The fifth one is the 5-0 clean-out by the 2000 Australians against the transitional West Indians.
The best away performance is the 1984 clean sweep of England by the mighty West Indians. Their performance is ranked seventh in the table. Incidentally this is the only time in history of Test cricket that a home team has lost all 5 Tests in a 5-Test series.
Given below is a one-line summary for each series and the match points secured.
615 2011 ENG-Ind 196r(73.80),   319r(81.88),   I&242r(87.45), I&8r(80.25).
55 1931 AUS-Saf I&163r(85.02), I&155r(84.77), 169r(73.09),   10w(78.54),
I&72r(82.22).
169 1970 SAF-Aus 170r(72.09),   I&129r(83.97), 307r(80.85),   323r(79.97).
120 1959 ENG-Ind I&59r(81.82),  8w(75.84),     I&173r(85.32), 171r(70.81),
I&27r(80.83).
436 2000 AUS-Win I&126r(83.88), I&27r(80.83),  5w(72.40),     352r(84.66),
6w(72.52).
...
256 1984 eng-WIN I&180r(85.54), 9w(72.12),     8w(75.38),     I&64r(81.97),
172r(73.78).
Now for the second table, this time ordered by the difference in series Win margin and Team strength differential value.
Ser Year Home Away Res # [...Win-margin..] [TS differential-] WinIndex
Now for the second part. Here I have matched the Win margin for the series with the Team Strength differential between the two teams, averaged over the series, and derived an overall WinIndex. The Team strength values are normalized to the same 100 points basis. In addition to the Team Strength indices already available with me, I have incorporated a substantial 10% weighting for the team playing at home. This alleviates the away defeats slightly. Couple of examples will explain this concept.
Take England and India. Their Team strength averages for the series worked out to 50.61-49.39 in favour of England, in other words, England were stronger by a wafer-thin difference. Once the home advantage was applied this became 52.99-47.01 which is a reasonably significant 6% differential. One would have expected this to translate to a 2-1 win with close matches all around. That result would have translated to a 55-45 on the Win- margin value and would not have raised any eyebrows. What happened was a 61.69% differential which translates to a final WinIndex value of 55.71 (being the difference between the two differential values.
Let us now look at South Africa and Australia during 1970. South Africa was a clear weaker team and their Team Strength differential was 47.13-52.87. When the home advantage was applied this became 49.51-50.49. One would have expected a 1-1 draw and almost 50-50 Win-margin value. What happened, as happened 41 years hence, was a 4-0 thrashing of the visiting team. The final WinIndex is the difference between 58.44 and -0.98, which works to a value of 59.52. In this measure this result has overtaken the 2011 series and is the most comprehensive win, taken in context.
The 1920 drubbing of England comes in next , followed by the top most away performance in this table, the 5-0 blitz by West Indies against England during 1984. The fifth entry shows the other side of the fascinating South Africa - Australia contests. A stronger South African team losing to an unfancied Australian team, 0-3.
Now for the methodology.
Valuation of draws: In Test matches draws are not the straight-forward 0-0 or 1-1 or 0-0 matches in Football or Hockey. At two extremes, a draw can happen with one team a ball away from victory or it could happen that the match might have had a result had the match continued for 10 days. To take care of these widely-varying grey areas I have allotted a wide range of 40-60 points out of 100 for a draw. This also correctly means that the winning team will at least have a margin of 61-39.
Look at the following matches. The Win-margin values are self-explanatory.
Test#  236: Eng 200 ao & 229/6. Aus 584 ao. (Aus-Eng: 60-40).
Test#  616: Aus 143 & 148/8. Saf 332/9.     (Saf-Aus: 60-40).
Now look at the following matches. Two different types of 50-50 matches.
Test #1887: Aus 430 & 228/6. Ind 360 & 177/4. Match completely open (50-50).
Test #1781: Pak 679/7. Ind 410/1.   Timeless Test needed for result (50-50).
Valuation of Innings wins: There is no denying that innings wins are the most emphatic in Test cricket. And needless to add that a win by an innings and 242 runs is far more emphatic than a win by an innings and 8 runs. The most emphatic win in Test cricket is the Oval 1938 win of England over Australia, by an innings and 579 runs. This result gets an almost full score. The formula is
Innings win points = 80.0 + variable points based on the quantum of innings win.
Valuation of wins by Wickets: A ten-wicket win ranks quite close to an innings win while a one-wicket win ranks close to the minimum points for a win. This is a tricky situation and is handled by the following formula. It is essential to distinguish between a nine-wicket win with a 20 for 1 score and one with a score of 342 for 1. The first is very close to an innings win and the later is quite a tough win and the losing team needs to be given credit for setting the target.
Wicket win points = 60.0 + variable points based on wickets in hand and target.
Valuation of wins by Runs: Wins by runs have the widest range in the results analysis. A 675-run win (this happened during 1928) probably should rank just behind the 1938 win while a 1-run win (happened in 1993) could have resulted in a loss with a one-ball switch of events. So any algorithm should take this into account. This is achieved by the following formula which has to distinguish between a 200 run win chasing 300 and a 200 run win chasing 500. The first is a more emphatic win and in the later case, the losing team needs to be given credit for setting the target.
Run win points = 60.0 + variable points based on runs differential.
The Match rating points are determined for each match, added for the series and divided by the number of matches. The final pair of numbers, say x-y (again x+y=100), reflects the series results in a very accurate manner. This would result in a very objective evaluation of the series concerned and substantiate the, mostly correct, subjective statements made by the experts.
I did a far simpler exercise for another article. I got all wins to a "Runs" basis using wickets left and match RpW in case of "wickets" and "innings" wins and the margin itself in case of "runs" wins. The results look amazingly alike indicating that one can slice and dice this in any way, it will remain the greatest ever defeat by an established Test team. The hypothesis I started with is proved without any doubt. The summarized table for that analysis is shown below.
Ser Year Home  Away # Win  Res WinRuns LossRuns
(Series average)
Where does Indian Test cricket go from here. Many better writers, players and administrators than me have already spoken. I am not going to repeat those words. These comments all have validity. I will conclude with one summary.
This result cannot be wished away with comments such as "one bad series", "one cannot win everything", "a blip", "we will bounce back", "let England come to India" or "form is temporary, class is permanent" etc. This is a clean-up at the highest level and unless otherwise BCCI realizes this, India will find it difficult to recover in the years to come. They might very well remain amongst the top-2 ODI/T20 teams, but would slip down the Test ladder quickly.
The players must share the blame, but only a smaller share. The proud men they are, they must be hurting like hell. However BCCI should feel the hurt intensely. While recognizing the zone at which the marvellous English team played, let me assign the blame component, strictly within Indian cricket, and in sync with the tone of the article, as 80-20 for BCCI-Players. This one allocation tells the story. The wild-sweep term "BCCI" includes, amongst others, the President, Secretary/IPL-GC member/IPL-owner, selectors, training methods, fitness evaluation criteria, IPL, paid propagandists, PR men, schedulers, rest of the gravy-train occupants et al.
As far as England are concerned, they may lack the couple of big names and heavy hitters to sustain an occupancy at the top for a decade or so as the 1980 West Indians and 1990/2000 Australians did. However they have the quality, bench-strength and the ability to travel well to be a serious contender for the top position always, during the next 5 years. They may even lose the top position without playing another match. But that should not matter. They would bounce back. Their serious problem might be when they defend the 3-1 away win in Australia and 4-0 home win over India.
This seems to be the season for felling giant oaks. The Indian team, with high hopes and pedigree, was vanquished. A quirky and dubious rule pushed the greatest sprinter of all time, Usain Bolt, from the World Athletics 100 metres Final. Federer seems to be losing to all and sundry. Tiger Woods does not growl but mews. Arsenal loses to Manchester United 2-8. But the abiding memory through all these was the 400 metres semi final. To see Oscar Pistorius finish the 400 metres in 46.19 secs, running on carbon fibre legs (I hope someone does not send an insensitive comment that he gains by running on carbon fibre) was indeed heart-warming stuff. Incidentally this time would have won for Pistorius the 400 metres Gold medal in the 1956 Melbourne Olympics !!!
To download the multiple tables of the 210 x 4/5 Test series, please right-click here and save the file.
As per Kartick's request I have given below all 3-Test series which ended in 3-0 results, ordered by the Win margin.
Ser Year Home Away Res # Win Margin RunIdx
Anantha Narayanan has written for ESPNcricinfo and CastrolCricket and worked with a number of companies on their cricket performance ratings-related systems