Beefy? Laker? Murali? Hadlee? Who has done it the best?
A look at bowlers with the highest-rated four- and five-wicket hauls, bowlers with the best frequency of top performances, and more
Anantha Narayanan
13-Oct-2018
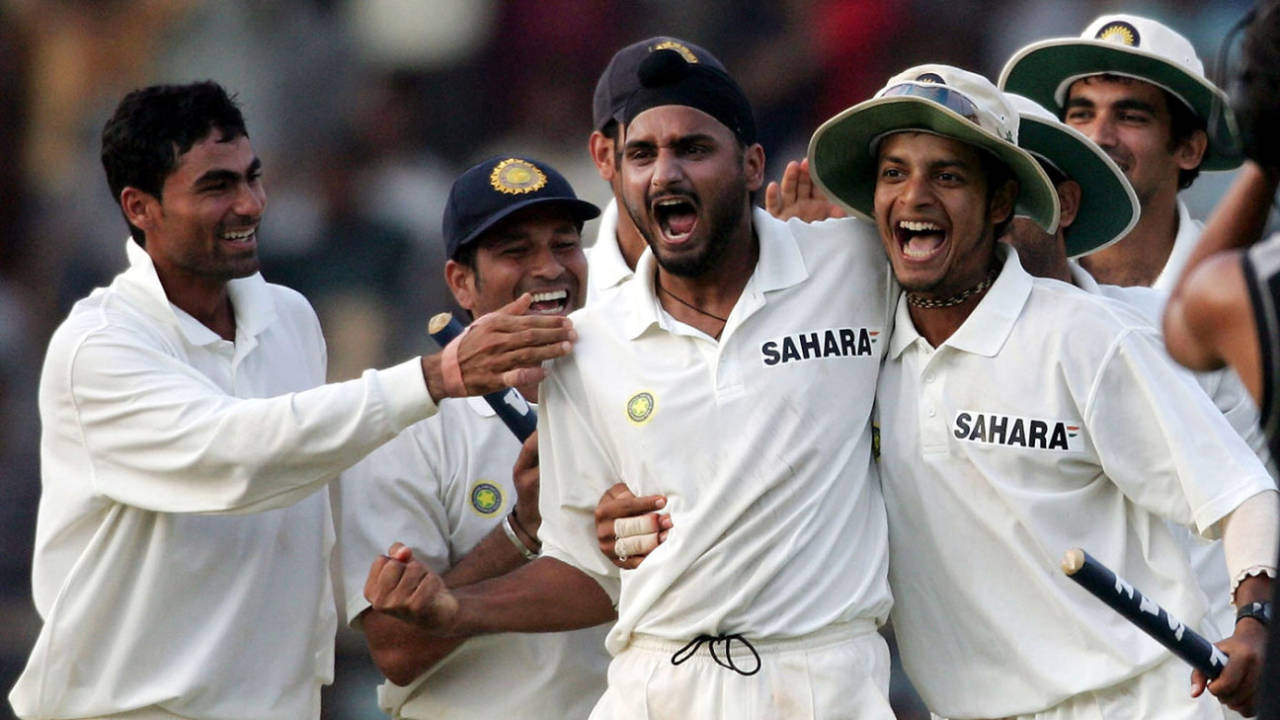
In 2004 in Mumbai, Harbhajan Singh took 5 for 29 in a narrow win over Australia • Hamish Blair/Getty Images
First, on the terminology used in these pieces: GW25 (Golden Willow 25) and RC25 (Red Cherry 25) have been established in the earlier articles. I will use GW25-100 and RC25-100 to represent the Top 100 tables. I will refer to the 3200-odd entries (that have rating points greater than 400) as GW25-Selection or RC25-Selection.
I have created an Excel sheet containing the RC25 performances over 500 points which can be downloaded here. In it I have given the PQI (Pitch Quality Index) for each performance so that the readers can gauge the nature of the pitch and relate this important measure to the performance. Remember that the PQI value is on a scale of 0-100; a low PQI value indicates a lot of help to the bowlers and a high PQI value indicates that it was a batsman-friendly pitch. I have also given the Wicket-Value, which is arguably the most important measure used in the RC25 analysis. It is a composite of the dismissed batsman's batting average and the runs saved if the batsman was dismissed below his average.
RC25 Potpourri
Bowlers in list
I have already mentioned that Jim Laker and Muttiah Muralitharan are the only bowlers to have two performances each in the RC25 list. Continuing on that theme, there are no fewer than 16 bowlers with two performances each in the RC25-100 table. However, Murali reigns supreme with four. Kapil Dev and Vernon Philander have three each.
I have already mentioned that Jim Laker and Muttiah Muralitharan are the only bowlers to have two performances each in the RC25 list. Continuing on that theme, there are no fewer than 16 bowlers with two performances each in the RC25-100 table. However, Murali reigns supreme with four. Kapil Dev and Vernon Philander have three each.
Highest-rated five-wicket hauls
West Indies v England, Port-of-Spain, 1973-74: Tony Greig 33-7-70-5 - 764 points (Batsmen dismissed: Kallicharran 0, Kanhai 7, Lloyd 13, Murray 33 and Inshan Ali 15; while defending 226 in the fourth innings)
Australia v India, Melbourne, 1980-81: Kapil Dev 16.4-4-28-5 - 741 points (Yardley 7, Border 9, Marsh 3, Lillee 4 and Higgs 0; while defending 143)
India v Australia, Mumbai, 2004-05: Harbhajan Singh 10.5-2-29-5 - 728 points (Hayden 24, Katich 1, Gilchrist 5, Kasprowicz 7 and McGrath 0; while defending 105)
Highest-rated four-wicket spells
Australia v England, Sydney, 1936-37: Bill Voce 8-1-10-4 - 616 points (Bradman - 0, McCabe 0, O'Brien 0 and Fingleton 12 - That is some haul!)
England v South Africa, Trent Bridge, 1951: Tufty Mann 24-16-24-4 - 615 points (Ikin 33, Watson 5, Bailey 11 and Evans 0; while defending 186)
Australia v West Indies, Adelaide, 1992-93: Curtly Ambrose 26-5-46-4 - 613 points (Boon 0, Steve Waugh 4, Border 1 and Hughes 1; while defending 186)
Australia v West Indies, Adelaide, 1992-93: Curtly Ambrose 26-5-46-4 - 613 points (Boon 0, Steve Waugh 4, Border 1 and Hughes 1; while defending 186)
Highest-rated three-wicket hauls
India v Pakistan, Bangalore, 2004-05: Shahid Afridi 17-7-13-3 - 492 points (Tendulkar 16, Laxman 5 and Ganguly 2; while defending 383)
India v Australia, Mumbai, 2004: Murali Kartik 12-3-32-3 - 488 points (Ponting 12, Martyn 0 and Clarke 7)
South Africa v Australia, Durban, 2001-02: Jacques Kallis 11-2-29-3 - 485 points (Mark Waugh 30, Martyn 0 and Gilchrist 16)
Lowest-rated six-wicket hauls
In the South Africa-New Zealand Test in Cape Town in 1961-62, Sydney Burke's 6 for 128 secured a mere 371 points. David Pithey's 6 for 58 against New Zealand in 1963-64 managed only 375. Recently, Yasir Shah's 6 for 184 against Sri Lanka in Dubai got just 386 points.
Lowest-rated five-wicket hauls
Australia's Joey Palmer took 5 for 103 against England in 1882-83, a performance that secured a mere 307 points. Bonnor Middleton of South Africa took 5 for 64 against England in 1895-86, which managed to garner only 308 points. Moving on to more familiar times, Bishan Bedi's 5 for 110 against England in 1976-77 secured only 339 points. Wahab Riaz's 5 for 88 against West Indies in 2016-17 got only 353 points. Finally, in that "drawn-with-scores-level Test" in Mumbai against West Indies in 2011-12, R Ashwin's 5 for 156 managed to get only 358 points.
Tests with the most RC25-Selection performances
7 x 400 points:
Sri Lanka v Australia, Kandy 2003-04: Nuwan Zoysa, Muralitharan, Michael Kasprowicz, Warne, Muralitharan, Jason Gillespie and Shane Warne.
Sri Lanka v Australia, Kandy 2003-04: Nuwan Zoysa, Muralitharan, Michael Kasprowicz, Warne, Muralitharan, Jason Gillespie and Shane Warne.
5 x 500:
Australia v England, Melbourne, 1903-04: Len Braund, Monty Noble, Tibby Cotter, George Hirst and Hugh Trumble
India v Pakistan, Bengaluru, 1986-87: Maninder Singh, Iqbal Qasim, Tauseef Ahmed, Qasim and Tauseef. This was Gavaskar's farewell Test
England v Australia, The Oval, 1997: Glenn McGrath, Phil Tufnell, Michael Kasprowicz, Tufnell and Andrew Caddick
2x700:
Australia v England, Melbourne, 1903-04: Wilfred Rhodes, in each innings
England v Australia, Old Trafford, 1948: Jim Laker, in each innings - both above 800
West Indies v England, Port-of-Spain, 1973-74: Tony Greig in each innings - 800 + 700
Australia v England, Melbourne, 1903-04: Wilfred Rhodes, in each innings
England v Australia, Old Trafford, 1948: Jim Laker, in each innings - both above 800
West Indies v England, Port-of-Spain, 1973-74: Tony Greig in each innings - 800 + 700
Series with the most RC25-Selection performances
Both teams: Australia v England 1974-75. Total of 18 (Australia ten and England 8)
One team: England v Australia 1993. Australia - 13 performances
One team: England v Australia 1993. Australia - 13 performances
Other tables
| Bowler | Performances | Spells | Frequency |
|---|---|---|---|
| SF Barnes | 25 | 50 | 2.00 |
| CV Grimmett | 24 | 67 | 2.79 |
| RJ Hadlee | 53 | 150 | 2.83 |
| M Muralitharan | 79 | 230 | 2.91 |
| Yasir Shah | 17 | 54 | 3.18 |
| WJ O'Reilly | 15 | 48 | 3.20 |
| R Ashwin | 34 | 118 | 3.47 |
| Fazal Mahmood | 15 | 53 | 3.53 |
| GA Lohmann | 10 | 36 | 3.60 |
| Mohammad Asif | 12 | 44 | 3.67 |
| DK Lillee | 35 | 132 | 3.77 |
| Imran Khan | 37 | 142 | 3.84 |
| GP Swann | 28 | 109 | 3.89 |
| Saeed Ajmal | 17 | 67 | 3.94 |
| HMRKB Herath | 42 | 168 | 4.00 |
| DW Steyn | 40 | 161 | 4.03 |
| AK Davidson | 20 | 82 | 4.10 |
| SK Warne | 66 | 273 | 4.14 |
| Shakib Al Hasan | 21 | 89 | 4.24 |
| TM Alderman | 17 | 73 | 4.29 |
There is no surprise here. Sydney Barnes was among the best bowlers ever and his wickets-per-Test value of 7.0 has never been overhauled. This results in his top position, with an RC25 performance every other spell. The next three bowlers are truly great ones and these four together form a great quartet. It is a little bit of a surprise but equally wonderful that Richard Hadlee has a figure marginally better than Murali's. Yasir's presence in the top five indicates how much he has delivered for Pakistan recently. Also note the high top-ten position of R Ashwin (though most of his successes have come at home).
| Bowler | Performances | Spells | Frequency |
|---|---|---|---|
| M Muralitharan | 79 | 230 | 2.91 |
| SK Warne | 66 | 273 | 4.14 |
| RJ Hadlee | 53 | 150 | 2.83 |
| A Kumble | 50 | 236 | 4.72 |
| GD McGrath | 48 | 243 | 5.06 |
| JM Anderson | 43 | 267 | 6.21 |
| HMRKB Herath | 42 | 168 | 4.00 |
| DW Steyn | 40 | 161 | 4.03 |
| Imran Khan | 37 | 142 | 3.84 |
| CA Walsh | 36 | 242 | 6.72 |
| SM Pollock | 36 | 202 | 5.61 |
| IT Botham | 35 | 168 | 4.80 |
| DK Lillee | 35 | 132 | 3.77 |
| MD Marshall | 34 | 151 | 4.44 |
| R Ashwin | 34 | 118 | 3.47 |
| Kapil Dev | 33 | 227 | 6.88 |
| Harbhajan Singh | 32 | 190 | 5.94 |
| Waqar Younis | 32 | 154 | 4.81 |
| SCJ Broad | 30 | 225 | 7.50 |
| Wasim Akram | 30 | 181 | 6.03 |
| CEL Ambrose | 30 | 179 | 5.97 |
In terms of sheer numbers, Murali reigns supreme, with 79 performances. Warne comes into his own with 66 and is in second position. Hadlee again surprises us by pipping Anil Kumble, who has nearly 200 wickets more. This table mirrors the top-wickets table more or less, with the exception of Hadlee and Rangana Herath. McGrath is in fifth position. These five bowlers could easily be in anyone's list of top-five bowlers ever. And look at the bowlers who follow them.
| Bowler | Team | Tests | Wickets | RtgPts | Pts/Wkt | AvgePts |
|---|---|---|---|---|---|---|
| SF Barnes | Eng | 27 | 189 | 17487 | 92.5 | 647.7 |
| CV Grimmett | Aus | 37 | 216 | 21513 | 99.6 | 581.4 |
| GA Lohmann | Eng | 18 | 112 | 10318 | 92.1 | 573.2 |
| M Muralitharan | Sl | 133 | 800 | 74777 | 93.5 | 562.2 |
| WJ O'Reilly | Aus | 27 | 144 | 15108 | 104.9 | 559.6 |
| Yasir Shah | Pak | 28 | 165 | 15520 | 94.1 | 554.3 |
| R Ashwin | Ind | 63 | 333 | 33874 | 101.7 | 537.7 |
| CTB Turner | Aus | 17 | 101 | 9030 | 89.4 | 531.2 |
| RA Jadeja | Ind | 38 | 182 | 19771 | 108.6 | 520.3 |
| Saeed Ajmal | Pak | 35 | 178 | 17978 | 101.0 | 513.7 |
| RJ Hadlee | Nz | 86 | 431 | 43998 | 102.1 | 511.6 |
| DK Lillee | Aus | 70 | 355 | 35684 | 100.5 | 509.8 |
| R Peel | Eng | 20 | 101 | 10038 | 99.4 | 501.9 |
| SK Warne | Aus | 145 | 708 | 72011 | 101.7 | 496.6 |
| DW Steyn | Sa | 88 | 421 | 43543 | 103.4 | 494.8 |
| Mohammad Asif | Pak | 23 | 106 | 11247 | 106.1 | 489.0 |
| GD McGrath | Aus | 124 | 563 | 60634 | 107.7 | 489.0 |
| C Blythe | Eng | 19 | 100 | 9262 | 92.6 | 487.5 |
| MD Marshall | Wi | 81 | 376 | 39393 | 104.8 | 486.3 |
| RJ Harris | Aus | 27 | 113 | 12667 | 112.1 | 469.1 |
| CEH Croft | Wi | 27 | 125 | 12639 | 101.1 | 468.1 |
Barnes tops the bowlers' table. This is not surprising considering his 189 wickets in 27 Tests. Clarrie Grimmett is in second place. These two were at the top of the RC25-Frequency table as well. Then there are some changes. George Lohmann comes in because of his 100-plus wickets. He is followed by Murali, who played many more Tests. Bill O'Reilly leapfrogs Yasir Shah, but there is a new entrant occupying a top-ten position: Ravindra Jadeja is ninth, indicating that while he might not have delivered RC25-level performances often, he has been very consistent - again, with the rider that most of these performances have been at home.
| Bowler | Team | Tests | Runs | Wickets | RtgPts | AvgePts |
|---|---|---|---|---|---|---|
| R Ashwin | Ind | 63 | 2296 | 333 | 42913 | 681.2 |
| RJ Hadlee | Nz | 86 | 3124 | 431 | 57356 | 666.9 |
| Shakib Al Hasan | Bng | 53 | 3692 | 196 | 33294 | 628.2 |
| Imran Khan | Pak | 88 | 3807 | 362 | 53741 | 610.7 |
| GS Sobers | Wi | 93 | 8032 | 235 | 55317 | 600.1 |
| TL Goddard | Sa | 41 | 2516 | 123 | 24590 | 599.8 |
| IT Botham | Eng | 102 | 5200 | 383 | 60616 | 594.3 |
| SM Pollock | Sa | 108 | 3781 | 421 | 61959 | 573.7 |
| CL Cairns | Nz | 62 | 3320 | 218 | 35535 | 573.1 |
| MG Johnson | Aus | 73 | 2065 | 313 | 41542 | 569.1 |
| KR Miller | Aus | 55 | 2958 | 170 | 30799 | 560.0 |
| R Benaud | Aus | 63 | 2201 | 248 | 35263 | 559.7 |
| Wasim Akram | Pak | 104 | 2898 | 414 | 55053 | 529.4 |
| AW Greig | Eng | 58 | 3599 | 141 | 30526 | 526.3 |
| MH Mankad | Ind | 44 | 2109 | 162 | 23126 | 525.6 |
| A Flintoff | Eng | 79 | 3845 | 226 | 40634 | 514.3 |
| DL Vettori | Nz | 113 | 4531 | 362 | 56025 | 495.8 |
| JH Kallis | Sa | 166 | 3289 | 292 | 82084 | 494.5 |
| Kapil Dev | Ind | 131 | 5248 | 434 | 64385 | 491.5 |
| BA Stokes | Eng | 46 | 2779 | 112 | 22502 | 489.2 |
Now, for the biggest surprise. The career all-round performances table is topped by Ashwin, ahead of the more famous allrounders. The main reason is that his bowling numbers are those of top-class bowlers (5.3 wickets per Test) while his batting average of 29.4 is higher than those of batsmen like Grant Flower, Martin Guptill, Roshan Mahanama, Alistair Campbell and Mark Ramprakash. He almost matches Kris Srikkanth. These numbers have helped move him to the top. And let us not forget that the location concept is built into the RC25 computations, so these points are already diluted because Ashwin has achieved most of his success at home. Hadlee is in a well-deserved second place thanks to his low bowling average of 22.3 and very good batting average of 27.2.
Shakib Al Hasan is at No. 3. There is no denying what he has achieved for Bangladesh: 3700 runs at an average of near 40 and 196 wickets at an average near 32 are testament to his skills. Imran Khan is in fourth position. Garry Sobers just about edges Trevor Goddard into fifth. Most of the other top allrounders are in the top ten.
I have a specific request for the readers: please do not send in comments saying, "Do you mean to say that Ashwin is a better bowler than Lillee, or Goddard is a better allrounder than Botham?" I am not saying anything like that. Far from it. This is just a table of the average RC25 and GW25 points secured by players in a Test. If anyone concludes that any given player is better than another, it will only indicate their own short-sightedness. Respect the numbers, respect my work, interpret the results properly, and do not imply conclusions that I have not drawn.
| Bowler | Team | Test | Year | Res | Vs | Spell1 | Spell2 | Spell1-Pts | Spell2-Pts | Match-Pts |
|---|---|---|---|---|---|---|---|---|---|---|
| Laker | ENG | 428 | 1956 | Won | Aus | 9/ 37 | 10/ 53 | 809.1 | 837.1 | 1646.2 |
| Greig | ENG | 738 | 1974 | Won | Wi | 8/ 86 | 5/ 70 | 818.3 | 763.8 | 1582.1 |
| Fazal Mahmood | PAK | 390 | 1954 | Won | Eng | 6/ 53 | 6/ 46 | 690.9 | 829.3 | 1520.2 |
| Massie | AUS | 699 | 1972 | Won | Eng | 8/ 84 | 8/ 53 | 690.1 | 786.1 | 1476.2 |
| Hadlee | NZ | 1029 | 1985 | Won | Aus | 9/ 52 | 6/ 71 | 860.2 | 609.4 | 1469.5 |
| Rhodes | ENG | 79 | 1904 | Won | Aus | 7/ 56 | 8/ 68 | 731.0 | 738.4 | 1469.4 |
| Verity | ENG | 234 | 1934 | Won | Aus | 7/ 61 | 8/ 43 | 668.4 | 784.2 | 1452.6 |
| Botham | ENG | 874 | 1980 | Won | Ind | 6/ 58 | 7/ 48 | 627.7 | 776.7 | 1404.4 |
| Spofforth | AUS | 9 | 1882 | Won | Eng | 7/ 46 | 7/ 44 | 627.4 | 774.5 | 1402.0 |
| Holding | WI | 781 | 1976 | Won | Eng | 8/ 92 | 6/ 57 | 726.0 | 674.2 | 1400.2 |
| Fazal Mahmood | PAK | 471 | 1959 | Won | Wi | 6/ 34 | 6/ 66 | 666.4 | 726.8 | 1393.2 |
| Harbhajan | IND | 1539 | 2001 | Won | Aus | 7/133 | 8/ 84 | 624.4 | 720.0 | 1344.5 |
| Blythe | ENG | 94 | 1907 | Won | Sa | 8/ 59 | 7/ 40 | 621.0 | 723.0 | 1343.9 |
| Barnes | ENG | 131 | 1913 | Won | Sa | 8/ 56 | 9/103 | 674.5 | 664.5 | 1339.0 |
| Tayfield | SA | 361 | 1952 | Won | Aus | 6/ 84 | 7/ 81 | 608.5 | 730.3 | 1338.9 |
| Muralitharan | SL | 1423 | 1998 | Won | Eng | 7/155 | 9/ 65 | 561.7 | 777.1 | 1338.8 |
| O'Keefe | AUS | 2250 | 2017 | Won | Ind | 6/ 35 | 6/ 35 | 664.0 | 671.9 | 1335.9 |
| Bedser | ENG | 372 | 1953 | Drawn | Aus | 7/ 55 | 7/ 44 | 601.4 | 711.6 | 1313.0 |
| Johnson | AUS | 2119 | 2014 | Won | Sa | 7/ 68 | 5/ 59 | 717.8 | 585.8 | 1303.6 |
| Hoggard | ENG | 1734 | 2005 | Won | Sa | 5/144 | 7/ 61 | 482.8 | 818.2 | 1301.0 |
Now for the match bowling performances. Having captured 95% of the match wickets in a Test, it would have been a huge surprise if Laker did not head this table. With both his innings performances in that Old Trafford Test finding places in the RC25 table, his match bowling performance points total is a massive 1646. The interest, as is usual in these Bradmanesque instances, is to find out whose performance is second. There are a few 17-wicket, 16-wicket and 15-wicket performances. However, these have all been pushed into the background by Tony Greig's magnificent 13-wicket haul in the West Indies, which fetch him a very impressive tally of 1582 points; both those performances are in the top 40. Fazal Mahmood's outstanding brace of almost identical six-wicket hauls in England in 1954 is in third position. This is followed by Bob Massie's debut performance of 16 wickets at Lord's. Hadlee's 15-wicket performance par excellence completes the top five.
| Player | Team | Year | Res | Vs | Inns1 | Inns2 | Inns1-Pts | Inns2-Pts | Match-Pts |
|---|---|---|---|---|---|---|---|---|---|
| Botham | ENG | 1980 | Won | Ind | 114 & 6/58 | 7/48 | 1406.9 | 627.7 | 2034.6 |
| Botham | ENG | 1981 | Won | Aus | 50 & 6/95 | 149 & 1/14 | 514.3 | 1328.7 | 1843.0 |
| Mushtaq Mohd | PAK | 1977 | Won | Wi | 121 & 5/28 | 56 & 3/69 | 917.9 | 880.7 | 1798.6 |
| Flintoff | ENG | 2005 | Won | Aus | 68 & 3/52 | 73 & 4/79 | 858.2 | 874.3 | 1732.6 |
| Hooper | WI | 1994 | Drawn | Ind | 81 & 5/116 | 67 & 2/62 | 654.8 | 989.4 | 1644.1 |
| Hadlee | NZ | 1980 | Won | Wi | 51 & 5/34 | 17 & 6/68 | 898.3 | 742.6 | 1641.0 |
| Shakib Hasan | BNG | 2017 | Won | Aus | 84 & 5/68 | 5 & 5/85 | 1097.8 | 541.8 | 1639.5 |
| Faulkner | SA | 1910 | Won | Eng | 78 & 5/120 | 123 & 3/40 | 728.5 | 896.8 | 1625.3 |
| Davidson | AUS | 498 | Drawn | Wi | 44 & 5/135 | 80 & 6/87 | 729.4 | 890.0 | 1619.3 |
| Border | AUS | 1989 | Won | Wi | 75 & 7/46 | 16 & 4/50 | 744.0 | 853.7 | 1597.7 |
| Tayfield | SA | 1952 | Won | Aus | 23 & 6/84 | 22 & 7/81 | 880.5 | 709.0 | 1589.5 |
| Vettori | NZ | 2008 | Won | Bng | 55 & 5/59 | 76 & 4/74 | 818.9 | 758.5 | 1577.5 |
| Atkinson | WI | 1955 | Drawn | Aus | 219 & 2/108 | 20 & 5/56 | 1288.6 | 264.0 | 1552.6 |
| Sobers | WI | 636 | Drawn | Eng | 152 & 3/72 | 95 & 3/53 | 789.8 | 757.4 | 1547.3 |
| Steyn | SA | 2008 | Won | Aus | 76 & 5/87 | 5/67 | 952.8 | 583.5 | 1536.4 |
| Perera | SL | 2016 | Won | Aus | 16 & 4/29 | 64 & 6/70 | 689.7 | 838.5 | 1528.2 |
| Benaud | AUS | 1956 | Won | Ind | 24 & 6/52 | 21 & 5/53 | 765.5 | 752.4 | 1517.9 |
| Noble | AUS | 1902 | Won | Eng | 47 & 5/51 | 8 & 6/52 | 930.2 | 579.6 | 1509.8 |
| Bates | ENG | 1883 | Won | Aus | 55 & 7/28 | 7/74 | 853.1 | 649.4 | 1502.6 |
| Botham | ENG | 1978 | Won | Nz | 103 & 5/73 | 30 & 3/38 | 808.2 | 677.7 | 1485.8 |
When we come to match-level all-round performances, Ian Botham reigns supreme with the top two performances. The first would be the top entry in almost anyone's list of match-level performances - in Mumbai in 1979-80, Botham totalled an incredible 2035 points. His first-innings tally of 1406 points is the highest achieved in a single innings. This masterclass is followed by the more familiar Headingley exploits a year or so later. Botham accumulated well over 1800 points at Headingley.
Mushtaq Mohammad collected nearly 1800 points for his 100, 50 and eight-wicket haul in Port-of-Spain in 1977. This was a match-winning performance away against a strong West Indian side. Andrew Flintoff's two invaluable fifties and seven wickets at Edgbaston in 2005 fetched him well over 1700 points. Finally, Carl Hooper's match-saving brace of fifties and seven wickets in Nagpur in 1994-95 got him just over 1600 points.
Readers can comment on this article here. Note that this link takes you outside ESPNcricinfo, and ESPNcricinfo does not monitor, publish, or otherwise associate itself with comments posted there.
Incorporating feedback/improvements for the top 25 batting and bowling performances
The pieces I did over the last three months on the top batting and bowling performances in Test history have elicited plenty of feedback. Based on that and on my own ideas, I have summarised the changes I expect to make in the Batting and Bowling Performance Ratings calculations going forward. Click here for more details on these changes.
The pieces I did over the last three months on the top batting and bowling performances in Test history have elicited plenty of feedback. Based on that and on my own ideas, I have summarised the changes I expect to make in the Batting and Bowling Performance Ratings calculations going forward. Click here for more details on these changes.
Anantha Narayanan has written for ESPNcricinfo and CastrolCricket and worked with a number of companies on their cricket performance ratings-related systems