Can't bat, can't bowl
This was India's fifth-worst series as a bowling unit, and their ninth-poorest with the bat. More stats highlights from the match and the series
S Rajesh
Jan 28, 2012, 6:17 AM
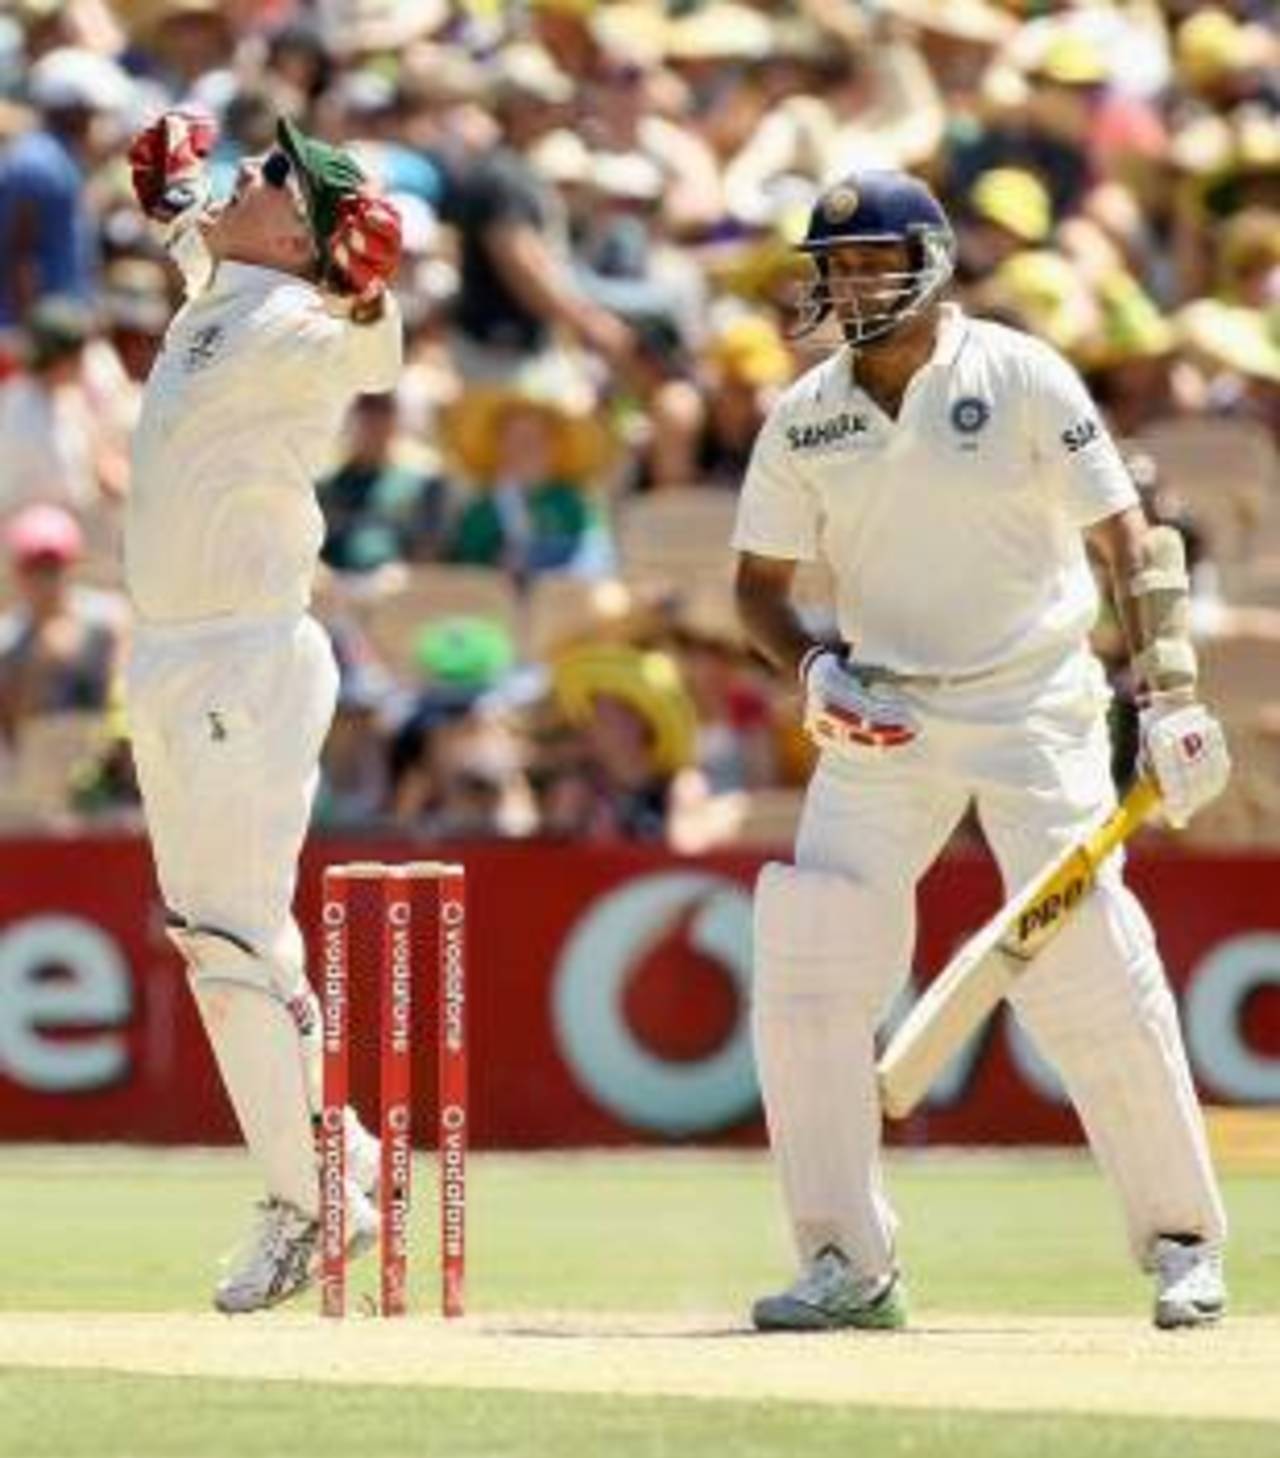
VVS Laxman's poor form contributed to what was the worst batting stats for India in a series in which their four big names all played in three or more Tests • Getty Images
S Rajesh is stats editor of ESPNcricinfo. Follow him on Twitter