Richards and Gilmour head the charts
A look at the best batting, bowling, allround, and team performances of the first two World Cups
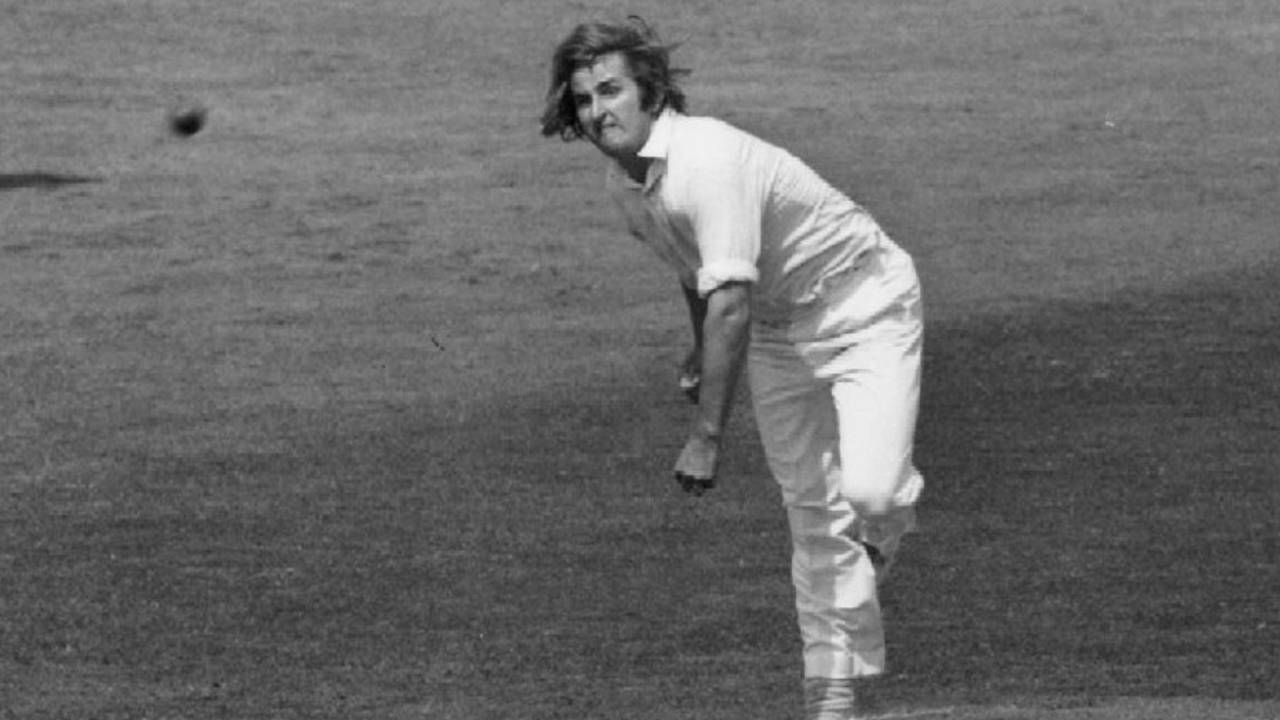
Gary Gilmour's 6 for 14 against England in 1975 is by far the best bowling performance of the first two World Cups • Getty Images
Since the first two World Cups had only 15 matches each, there is a shortage of top performances. Hence I have combined the two World Cups into one for this analysis. The latter World Cups will be covered independently, one by one.
A brief introduction into the methodology of Performance Analysis.
The Batting Performance Ratings analysis takes into account the Runs scored, Balls faced, Next highest score (if this is the highest score), % of Team score, Innings status at entry, Bowling quality, Pitch information, Team strengths, Target score in front, Match location, Result and Match importance. These parameters are given appropriate weights. The calculations are done in such a way that Rating points of 1000 would be allotted to a mind-blowing and match-winning score of 200 in 150 balls in a WC final.
The Bowling Performance Ratings analysis takes into account the Wickets captured, Quality of batsmen dismissed, Scores at which batsmen were dismissed, Bowling accuracy, Batting quality, Pitch information, Team strengths, Target being defended, Match location, Result and Match importance. The calculations are done in such a way that Rating points of 1000 would be allotted to a magnificent and match-winning analysis of 10-2-15-6 in a WC final.
The Player Performance Ratings analysis takes into account the Batting Rating points, Bowling Rating points and the Fielding Rating points, which is a combination of catches and stumpings. There are minimum criteria for batting and bowling stints to ensure that these are genuinely all-round performances.
The Team Performance Ratings analysis takes into account the Result, Margin of win, Resources utilized, Team strengths, Match location and Match importance. The calculations are done in such a way that Rating points of 1000 would be allotted to an overwhelming win by 150 runs or 8 wickets in a WC final.
Let us move on to the Performance Analysis tables for 1975 and 1979.
| SNo | Rating Pts | Year | ODI# | Batsman | For | Vs | Runs | Balls |
|---|---|---|---|---|---|---|---|---|
| 1 | 651 | 1979 | 74 | IVA Richards | West Indies | Eng | 138* | 157 |
| 2 | 514 | 1975 | 33 | CH Lloyd | West Indies | Aus | 102 | 85 |
| 3 | 443 | 1975 | 20 | GM Turner | New Zealand | Eaf | 171* | 201 |
| 4 | 441 | 1975 | 23 | KWR Fletcher | England | Nzl | 131 | 147 |
| 5 | 420 | 1979 | 74 | CL King | West Indies | Eng | 86 | 66 |
| 6 | 328 | 1975 | 28 | GM Turner | New Zealand | Ind | 114* | 177 |
| 7 | 318 | 1979 | 73 | Zaheer Abbas | Pakistan | Win | 93 | 122 |
| 8 | 291 | 1979 | 61 | CG Greenidge | West Indies | Ind | 106* | 173 |
| 9 | 290 | 1975 | 19 | DL Amiss | England | Ind | 137 | 147 |
| 10 | 265 | 1975 | 32 | AI Kallicharran | West Indies | Nzl | 72 | 92 |
Richards' match-winning century in the 1979 final is the best batting performance. This was not a swash-buckling innings by Richards but a measured innings-building effort. Richards was there from 22 for 1 to the end of the innings which occurred at 286 for 9. This is followed by Lloyd's hundred in the 1975 final. Lloyd's innings was the faster one but Richards was there right through. After the big innings by Turner against East Africa, we have a top-quality effort by Fletcher against New Zealand. Fletcher scored nearly half his team's score at a good rate. Then we come to the match-defining innings by Collis King in the 1979 final. To score at a S/R of over 125 in those days was not usual and this classic complemented Richards' effort perfectly.
| SNo | Rating Pts | Year | ODI# | Bowler | For | Vs | Analysis |
|---|---|---|---|---|---|---|---|
| 1 | 908 | 1975 | 31 | GJ Gilmour | England | Aus | 12.0 - 6 - 14 - 6 |
| 2 | 586 | 1975 | 33 | GJ Gilmour | West Indies | Aus | 12.0 - 2 - 48 - 5 |
| 3 | 555 | 1979 | 74 | J Garner | England | Win | 11.0 - 0 - 38 - 5 |
| 4 | 430 | 1979 | 71 | M Hendrick | Pakistan | Eng | 12.0 - 6 - 15 - 4 |
| 5 | 410 | 1975 | 33 | KD Boyce | Australia | Win | 12.0 - 0 - 50 - 4 |
| 6 | 379 | 1975 | 32 | RO Collinge | West Indies | Nzl | 12.0 - 4 - 28 - 3 |
| 7 | 361 | 1975 | 32 | BD Julien | New Zealand | Win | 12.0 - 5 - 27 - 4 |
| 8 | 349 | 1979 | 73 | CEH Croft | Pakistan | Win | 11.0 - 0 - 29 - 3 |
| 9 | 338 | 1979 | 73 | Asif Iqbal | West Indies | Pak | 11.0 - 0 - 56 - 4 |
| 10 | 332 | 1975 | 21 | DK Lillee | Pakistan | Aus | 12.0 - 2 - 34 - 5 |
The bowling table is headed by Gilmour's magnificent effort in the 1975 semi final against England. Gilmour broke the back of the England innings with a devastating spell of 6 for 14. He captured the first six wickets to fall. All were those of top order batsmen. This is the best ever bowling performance in ODI history and likely to remain as such for a long time. Gilmour's 5-wicket haul in the 1975 final follows next. It was, however, in a losing cause. Note the difference between the top two performances. Garner's match-winning 5 for 38 in the 1979 final follows next. Hendrick's wonderful spell against Pakistan deserves special mention. He captured 4 top-order wickets for 15 runs.
| SNo | Rating Pts | Year | ODI# | Player | For | Vs | Runs | Balls | Analysis |
|---|---|---|---|---|---|---|---|---|---|
| 1 | 1059 | 1975 | 31 | GJ Gilmour | Australia | Eng | 28* | 28 | 12.0-6-14-6 |
| 2 | 645 | 1975 | 33 | CH Lloyd | West Indies | Aus | 102 | 85 | 12.0-1-38-1 |
| 3 | 560 | 1975 | 33 | KD Boyce | West Indies | Aus | 34 | 37 | 12.0-0-50-4 |
| 4 | 382 | 1975 | 28 | S Abid Ali | India | Nzl | 70 | 98 | 12.0-2-35-2 |
| 5 | 318 | 1979 | 73 | IVA Richards | West Indies | Pak | 42 | 62 | 8.0-0-52-3 |
| 6 | 299 | 1979 | 71 | Asif Iqbal | Pakistan | Eng | 51 | 104 | 12.0-3-37-2 |
| 7 | 272 | 1979 | 66 | Majid Khan | Pakistan | Aus | 61 | 100 | 12.0-0-53-3 |
| 8 | 262 | 1975 | 30 | Sadiq Mohammad | Pakistan | Slk | 74 | 88 | 6.0-1-20-2 |
| 9 | |||||||||
| 10 |
Gilmour, after capturing 6 for 14 against England, would have liked to put his feet up. After all England was dismissed for 93. But Australia slumped to 39 for 6 and an embarrassing and devastating defeat looked likely. What did Gilmour do? He scored 28 priceless runs at run-a-ball and guided Australia home. This is the best Player performance in history of ODI cricket. After a lot of daylight comes Lloyd's all-round performance in the 1975 final. A tight spell of 12 overs complemented his 102 very well. Boyce also put in an excellent all-round performance in this match. He scored an invaluable 34 late in the order and then captured 4 for 50. In those days India did nothing of note. So it is nice to see Abid Ali's top-5 presence with his good spell of 2 for 35 and an excellent 70, down the order.
| SNo | Rating Pts | Year | ODI# | Team | Own score | Vs | Other score |
|---|---|---|---|---|---|---|---|
| 1 | 761 | 1979 | 74 | West Indies | 286 for 9 in 60.0 | Eng | 194 for 10 in 51.0 |
| 2 | 733 | 1975 | 31 | Australia | 94 for 6 in 28.4 | Eng | 93 for 10 in 36.2 |
| 3 | 708 | 1975 | 33 | West Indies | 291 for 8 in 60.0 | Aus | 274 for 10 in 58.4 |
| 4 | 676 | 1975 | 22 | West Indies | 87 for 1 in 20.4 | Slk | 86 for 10 in 37.2 |
| 5 | 670 | 1975 | 32 | West Indies | 159 for 5 in 40.1 | Nzl | 158 for 10 in 52.2 |
| 6 | 667 | 1979 | 73 | West Indies | 293 for 6 in 60.0 | Pak | 250 for 10 in 56.2 |
| 7 | 659 | 1975 | 24 | India | 123 for 0 in 29.5 | Eaf | 120 for 10 in 55.3 |
| 8 | 657 | 1975 | 29 | West Indies | 195 for 3 in 46.0 | Aus | 192 for 10 in 53.4 |
| 9 | 640 | 1979 | 68 | Sri Lanka | 238 for 5 in 60.0 | Ind | 191 for 10 in 54.1 |
| 10 | 631 | 1975 | 30 | Pakistan | 330 for 6 in 60.0 | Slk | 138 for 10 in 50.1 |
West Indies' comfortable 92 run win over England in the 1979 final leads the table. To do well in these tables teams have to do well in both departments. West Indies did so effectively. Australia's batsmen might have failed in the 1975 Semi final but their bowlers took them to the second position. Then comes the 1975 final which was won by West Indies narrowly. To those who might have a query on the (in)famous Indian loss to England. The fact that India lost only 3 wickets and lasted the full 60 overs gave them a few batting points and this reduced the impact of the loss.
The three inaugural tournaments, especially the first two, were dominated by West Indies. Barring a hiccup or two, they never looked like losing their grip. Their domination during these 8 years was reminiscent of the Australian domination during the early 2000s. They, however, slipped up in the third World Cup, a lapse Australia avoided.
The match of the 1975 World Cup was the West Indies win over Pakistan. Murray and Roberts added 64 runs in about 15 overs for the last wicket to win a pulsating match. If Pakistan had succeeded in capturing the last wicket, West Indies might not have qualified and ODI history might have to be re-written.
The innings of the tournament was, undoubtedly, Lloyd's hundred in the final. An emphatic statement for which there was no answer.
The bowling spell was Gilmour's effort against England.
The match of the 1979 World Cup was England's successful defence of 165 against Pakistan. The Indian ODI stock was so low that the win by Sri Lanka was not as much of an upset it seemed then.
Hendrick was unplayable against Pakistan. This was easily the bowling spell of the tournament.
The innings of the tournament was a toss-up between Richards' 138 and Collis King's 86. I would find it difficult to separate these two match-winning innings. Without one, the other would not have flourished. Pushed against the wall, I will plump for Richards, but only by 51-49.
Anantha Narayanan has written for ESPNcricinfo and CastrolCricket and worked with a number of companies on their cricket performance ratings-related systems