Five Tests, five defeats
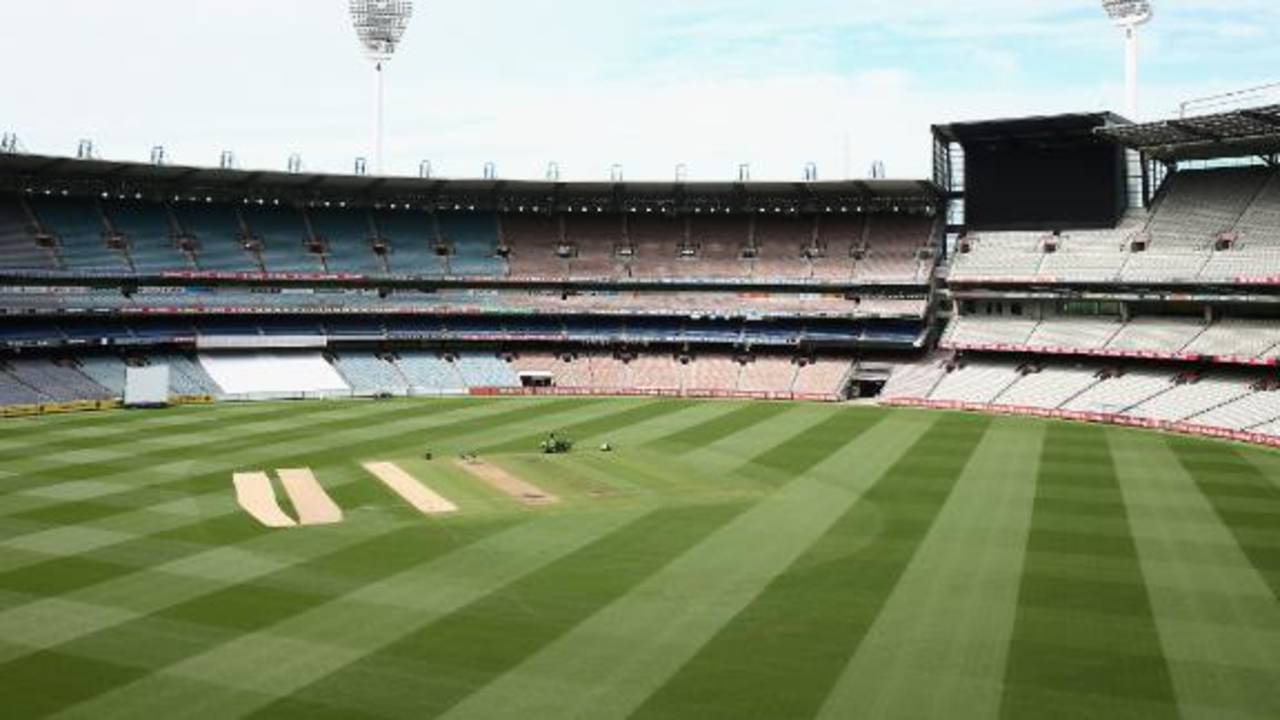
Stats preview to the Boxing Day Test in Melbourne, which hasn't seen a drawn Test since 1997, and where India have lost each of their last five matches
S Rajesh
25-Dec-2014
16 The number of successive Tests at the MCG that have produced a decisive result. The last draw here was in 1997, when Australia played South Africa. Among the 34 venues around the world which have hosted at least ten Tests since the beginning of 1998, the MCG is the only one without a single drawn Test match during this period.
13-3 Australia's win-loss record at the MCG since 1998. The only teams to be have beaten them during this period is England (in 1998), South Africa (2008) and England (2010).
5 The number of successive Tests that India have lost at the MCG - in 1991, 1999, 2003, 2007 and 2011. Before 1991, they had drawn in 1985, and won in 1981 and 1977, which makes Melbourne the only venue in Australia where India have won more than one Test. Overall, India have a 2-8 win-loss record here.
31.72 Average runs per wicket in Tests at the MCG since 2000, which is the lowest among Australian venues which have hosted at least five Tests during this period. The averages are 34.04 in Perth, 35.83 in Brisbane, 36.02 in Hobart, 37.23 in Sydney, and 39.82 in Adelaide.
2 The number of centuries that Indian batsmen have scored here in their last five Tests. The only hundreds have been by Virender Sehwag (195 in 2003) and Sachin Tendulkar (116 in 1999). Among the 11 fifty-plus scores by Indian batsmen in their last five Tests here, four have been by Sachin Tendulkar. During this period, they've averaged 23.92 runs per wicket here; in Sydney they've averaged 40.29.
40.73 Average runs per wicket for Australia in their first innings, when they bat first in an MCG Test, since 2000. During the same period, overseas teams average 25.90 runs per wicket in the first innings when they bat first.
24.18 The average runs per wicket for Australian fast bowlers at the MCG since 2000; overseas fast bowlers have averaged 35.92 during the same period. Australia's spinners have done much better too, averaging 30.73 compared to 55.15 by overseas spinners.
11.92 Mitchell Johnson's bowling average in his last two Tests at the MCG: against Sri Lanka in 2012 he took 6 for 79, while last year against England he had match figures of 8 for 88. Overall, Johnson averages 21.92 at the MCG, with 27 wickets in six Tests.
448 Runs for Shane Watson in four Tests here, at an average of 89.60. Those are his best stats at any venue. In seven Test innings at the MCG, he has five scores of 50 or more.
288 for 7 The average 90-over score on the first day of an MCG Test since 2000. When Australia bat first, their average 90-over score is 293 for 7; for overseas teams it's 269 for 8.
S Rajesh is stats editor of ESPNcricinfo. @rajeshstats