Sri Lanka's Test and ODI contrast
Outside the subcontinent Sri Lanka have struggled as a Test side, but their ODI results in the last seven years are the best among the subcontinent teams
S Rajesh
25-Jan-2013
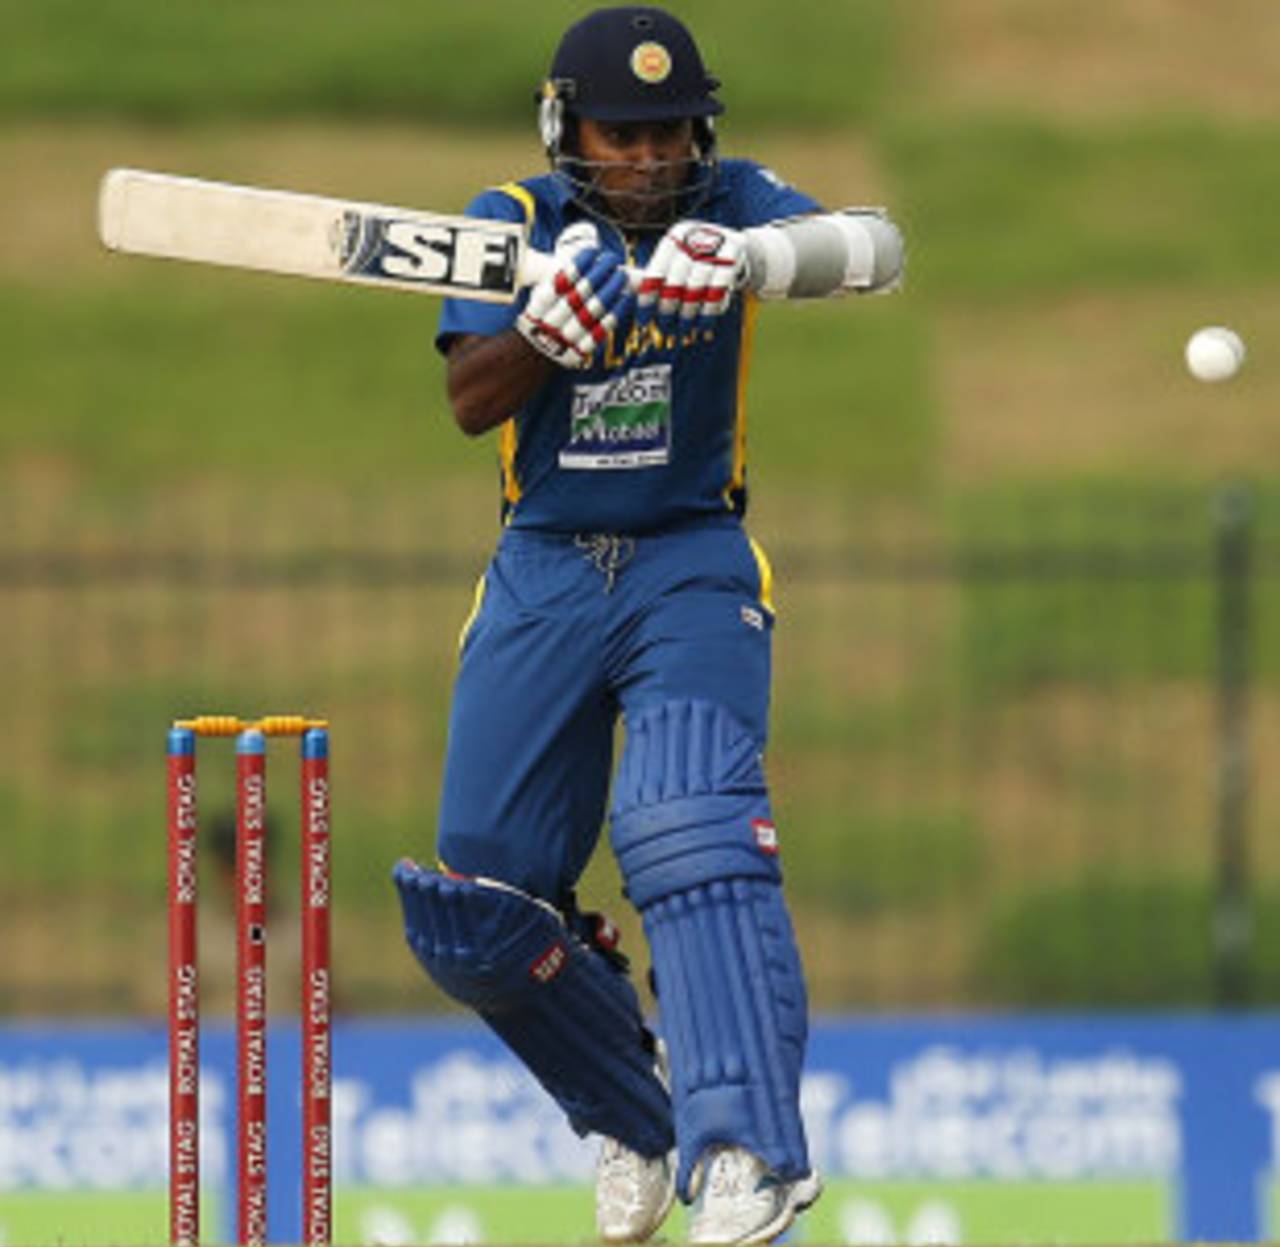
Mahela Jayawardene has a poor record in Tests outside the subcontinent in the last seven years, but in ODIs he has been pretty impressive • Associated Press
In the Test matches that they played in Australia, Sri Lanka were hopelessly outclassed: their batting was limp and inconsistent, and the bowling was consistently toothless (except for Rangana Herath). The result was a 3-0 whitewash, which meant their overall Test record in Australia was 11 defeats in 13 Tests, with two draws. Then came the ODIs, which gave Sri Lanka an opportunity to take on the hosts in a format they were far more proficient at. The result was a compelling, hard-fought series, in which the visitors gave as good as they got. Convincing wins in the second and third games put them 2-1 up in the series, a lead which they ultimately surrendered after the fourth game was controversially abandoned and the fifth went Australia's way by 32 runs.
The 2-2 drawn series, though, once again showed what a difference a change in format makes. (Simultaneously, in other parts of the cricketing world, New Zealand recovered from a shellacking in the Tests against South Africa to shock them in the ODIs, while India turned the tables on England after being outplayed in the Tests.)
Sri Lanka's results, though, conform to a pattern they've established when playing international cricket outside the subcontinent. Over the last few years, they've been extremely competitive in the 50-over format outside the subcontinent, even as they've continued to perform below par in Tests. As the table below shows, in the Test series in Australia, the bowlers - especially the pace attack - struggled to pick up wickets; the difference between the runs per wicket scored and conceded in the Tests was more than 21, but in the ODIs it came down to barely two runs, which illustrates just how much more competitive Sri Lanka were in the ODIs (though Australia's changed batting line-up in the ODI series also made it easier for the Sri Lankan bowlers).
| W/ L | Bat ave | Run rate | Bowl ave | Econ rate | |
| Tests | 0/ 3 | 24.94 | 3.05 | 46.34 | 3.59 |
| ODIs | 2/ 2 | 24.07 | 4.43 | 26.10 | 4.55 |
Going further back, to the beginning of 2006, the results show Sri Lanka have won almost as many matches as they've lost in one-day internationals in Australia, England, New Zealand and South Africa: in 64 games they've won 28 and lost 32. In Tests, though, they've lost ten out of 16, and won only three. They've managed to draw a series each in England and New Zealand, and win a Test in South Africa, but they've lost each of their five Tests in Australia during this period.
As on the tour to Australia, the significant improvement in ODIs over the Tests is in their bowling averages, which drops from 43.86 to 33.17. The batting averages go up too in the ODIs, which makes them a far more competitive team in this format.
| Format | Matches | W/L | Bat ave | Run rate | Bowl ave | Econ rate |
| Tests | 16 | 3/ 10 | 27.41 | 3.16 | 43.86 | 3.55 |
| ODIs | 64 | 28/ 32 | 31.14 | 5.16 | 33.17 | 5.25 |
Comparing the Test and ODI results of Sri Lanka with the two other big teams in the subcontinent - India and Pakistan - show quite clearly Sri Lanka's pre-eminence in the shorter format. While their win-loss in Tests is the worst among the three sides, in ODIs they are the best.
In Tests, both India and Pakistan have a 5-13 win-loss record, compared to Sri Lanka's 3-10. India were 5-5 before their recent free fall, which has resulted in eight successive losses, while Pakistan have been patchy as well, losing 3-0 to both Australia and England during this period. Sri Lanka's ratio is poorer than both those teams, though, and their bowling average of 43.86 runs per wicket is the worst among the three teams.
In ODIs, though, their win-loss ratio of 0.87 is the best among these three sides. (All these stats are matches played against the top sides only, excluding games against Bangladesh, Zimbabwe, and other non-Test-playing sides.) Sri Lanka have played more matches than the other two - and more than twice as many as Pakistan - and they've been competitive in most of them, once even blanking England 5-0 in 2006. Their bowling average, which was the worst among the three teams in Tests, is the best in ODIs.
| Team | Matches | W/ L | Ratio | Bat ave | Bowl ave |
| India | 24 | 5/ 13 | 0.38 | 30.72 | 40.79 |
| Pakistan | 21 | 5/ 13 | 0.38 | 26.53 | 33.15 |
| Sri Lanka | 16 | 3/ 10 | 0.30 | 27.41 | 43.86 |
| Team | Matches | W/ L | Ratio | Bat ave | Run rate | Bowl ave | Econ rate |
| Sri Lanka | 64 | 28/ 32 | 0.87 | 31.14 | 5.16 | 33.17 | 5.25 |
| India | 47 | 17/ 23 | 0.73 | 29.64 | 5.19 | 34.47 | 5.45 |
| Pakistan | 30 | 10/ 17 | 0.58 | 26.28 | 4.84 | 33.60 | 5.31 |
Unlike in Tests during this period, where most of Sri Lanka's batsmen have underperformed outside the subcontinent, in ODIs several of them have excelled. Kumar Sangakkara averages more than 42 in these countries during this period, against his overall ODI average of 38.56, while Dinesh Chandimal averages more than 50 in 22 innings, but the stats which best illustrates Sri Lanka's contrasting fortunes in these two formats belong to Mahela Jayawardene. In Tests in these countries during this period, Jayawardene averages 26.15 in 32 innings, with only five scores of more than 50. That's almost half his career average of 49.56. In ODIs, though, Jayawardene has excelled in these conditions, averaging 37.30 in 59 innings, which is four runs more than his career ODI average of 33.20.
| Batsman | Innings | Runs | Average | Strike rate | 100s/ 50s |
| Kumar Sangakkara | 57 | 2294 | 42.48 | 78.83 | 3/ 17 |
| Mahela Jayawardene | 59 | 1977 | 37.30 | 86.82 | 3/ 15 |
| Tillakaratne Dilshan | 58 | 1619 | 31.13 | 82.01 | 3/ 7 |
| Upul Tharanga | 32 | 1099 | 35.45 | 74.30 | 3/ 7 |
| Dinesh Chandimal | 22 | 873 | 51.35 | 77.66 | 1/ 8 |
| Angelo Mathews | 26 | 691 | 36.36 | 88.81 | 0/ 5 |
However, the biggest difference in averages has been in bowling, and more specifically in the averages of the fast bowlers. In Tests they've conceded more than 57 runs per wicket, but in ODIs it has dropped to a respectable 34.45. The spinners have been slightly more economical than the fast bowlers in ODIs, but they haven't been as effective in taking wickets. The contrast in averages between Tests and ODIs was even more stark for Sri Lanka's seamers on this tour to Australia: in Tests they averaged 59.47 runs per wicket; in ODIs it dropped to 24.06, with Nuwan Kulasekara and Lasith Malinga, their leading wicket-takers, both averaging less than 20.
| Wickets | Average | Econ rate | Strike rate | |
| Tests-pace | 94 | 57.55 | 3.78 | 91.1 |
| ODIs-pace | 277 | 34.45 | 5.26 | 39.3 |
| Tests-spin | 84 | 31.08 | 2.92 | 63.6 |
| ODIs-spin | 121 | 41.86 | 4.96 | 50.6 |
Among the Sri Lankan bowlers, Malinga leads the wicket-takers' list in these countries with 82 in 49 games, at an average of slightly less than 28. Kulasekara took plenty of wickets in Australia, but he hasn't been as successful in other series in these countries, averaging more than 41 runs per wicket. Chaminda Vaas and Muttiah Muralitharan, the two oldtimers, are next in the wicket-takers' list with averages in the mid-30s, and those averages have all helped make Sri Lanka a far more competitive side in ODIs outside the subcontinent.
| Bowler | Matches | Wickets | Average | Econ rate | Strike rate |
| Lasith Malinga | 49 | 82 | 27.98 | 5.36 | 31.3 |
| Nuwan Kulasekara | 42 | 42 | 41.47 | 4.95 | 50.2 |
| Muttiah Muralitharan | 33 | 39 | 35.76 | 4.72 | 45.4 |
| Chaminda Vaas | 30 | 35 | 33.91 | 4.57 | 44.4 |
| Thisara Perera | 17 | 23 | 27.69 | 6.14 | 27.0 |
| Farveez Maharoof | 21 | 21 | 36.42 | 5.12 | 42.6 |
All ODI stats exclude matches against Bangladesh, Zimbabwe, and other non-Test-playing sides.
S Rajesh is stats editor of ESPNcricinfo. Follow him on Twitter