The Powerplay kings, and other IPL stats
A look at some of the key stats from the third IPL, halfway into the tournament
S Rajesh
Apr 2, 2010, 2:59 AM
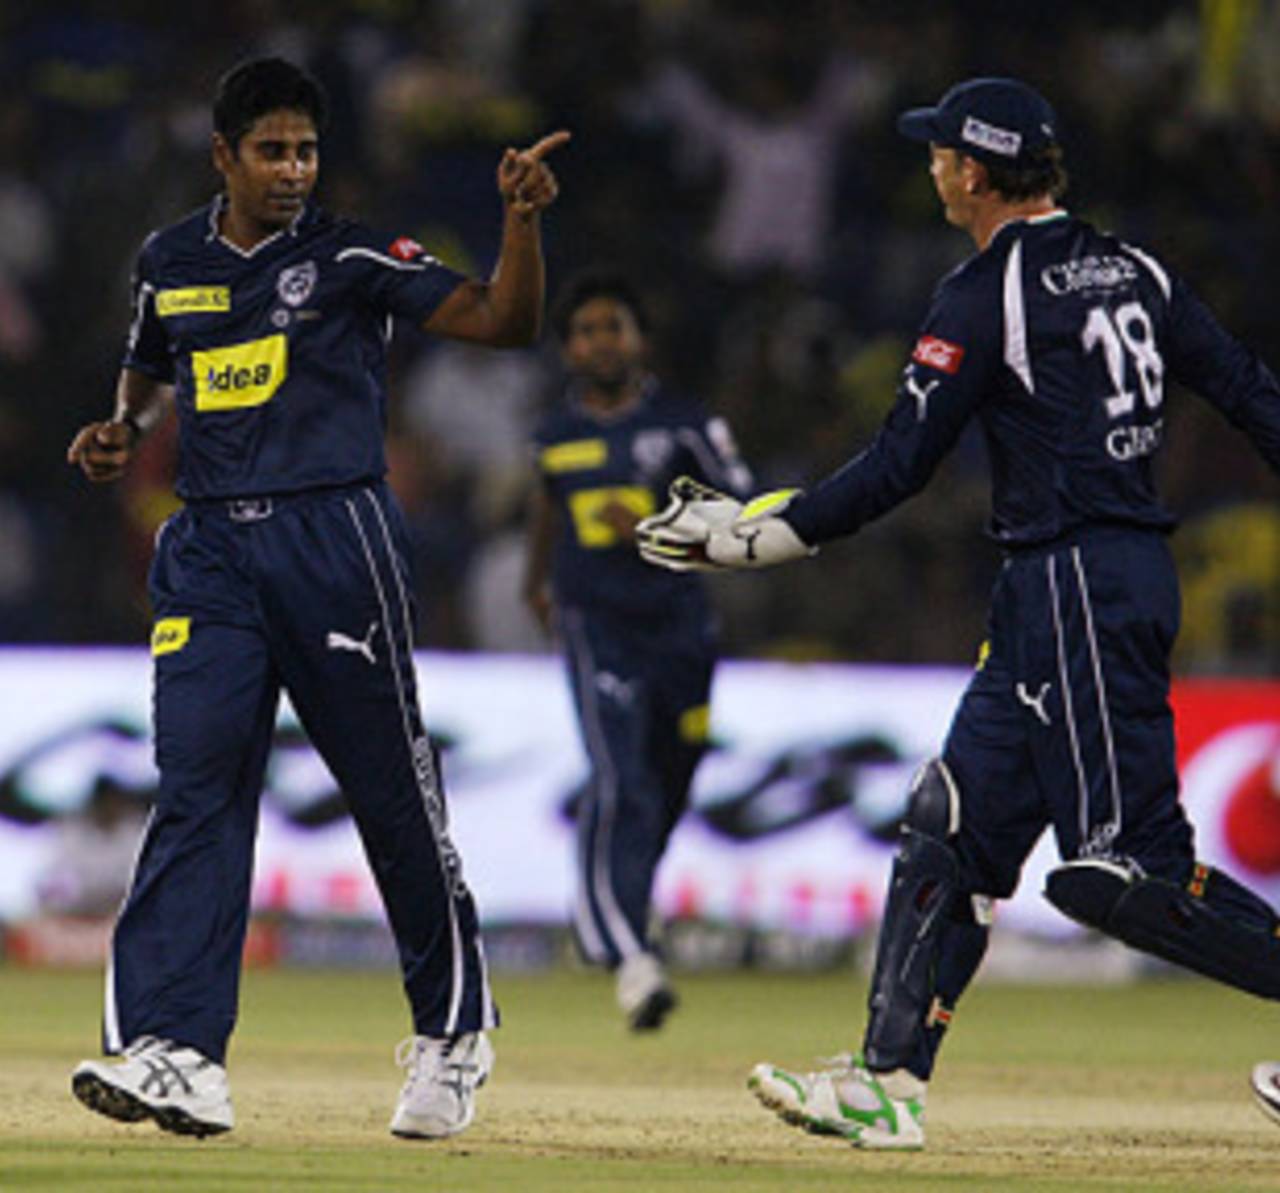
Chaminda Vaas: the best performer with the ball in the Powerplay overs in IPL 2010 • Indian Premier League
The IPL's third edition is almost at the halfway stage, with 29 out of 60 matches out of the way, and it's time to check out some of the key stats from the tournament so far. With the matches coming back to India after a gap of a year, it was expected that batsmen would have a better time than in the previous edition in South Africa, and that's exactly how it's turned out so far.
At the same stage of the tournament in 2008, batsmen had averaged a touch under 26 runs per wicket and 8.32 runs per over; the stats are pretty similar this year too, with the average rising fractionally to 26.05 but the run rate decreasing marginally to 8.21. In South Africa, of course, the batsmen struggled much more, with the average below 23 and the run rate less than eight.
The other interesting stat is the number of boundaries in these three editions at the halfway mark. The numbers this year are again closer to 2008 than to last year, with more fours and sixes being struck in the first edition than in this one so far - after 29 matches, there were 882 fours and 308 sixes in 2008, compared with 850 fours and 285 sixes this year. The difference is especially stark with 2009, especially in the number of fours - the quicker outfields in India have led to a 39% increase in the number of fours over last year. For the crowds, it has clearly been more entertainment this year.
| Year | Runs | Wkts | Average | Run rate | 4s | 6s |
| 2008 | 9078 | 350 | 25.93 | 8.32 | 882 | 308 |
| 2009 | 7655 | 340 | 22.51 | 7.56 | 613 | 248 |
| 2010 | 9251 | 355 | 26.05 | 8.21 | 850 | 285 |
Comparing the run rates of teams over the three IPLs it's clear that Mumbai Indians have moved ahead of the pack this year in terms of their run rate - they are the only team to have scored in excess of nine runs per over, thanks primarily to the outstanding form of their captain. Theirs has been a significant improvement from 2009, when they only managed a rate of 7.40.
The other team whose batting has improved significantly is Bangalore - their average runs per wicket has almost doubled from 2008, while the run rate too is much better than it was in the last two years.
For some of the other teams, the graphs have moved in the opposite direction: Kolkata's run rate continues to languish, while Punjab's batting woes are reflected in their batting average, which has dropped from 31.18 in 2008 to 20.44 this year. Quite remarkably, Delhi have exactly the same run rate this year as in 2008.
| Team | 2008 - Average | Run rate | 2009 - Average | Run rate | 2010 - Average | Run rate |
| Mumbai Indians | 26.32 | 8.34 | 23.13 | 7.40 | 29.16 | 9.15 |
| Delhi Daredevils | 27.44 | 8.48 | 28.41 | 7.73 | 27.70 | 8.48 |
| Royal Challengers Bangalore | 18.70 | 7.43 | 21.50 | 7.35 | 36.16 | 8.43 |
| Rajasthan Royals | 29.55 | 8.74 | 18.15 | 6.82 | 22.56 | 8.10 |
| Deccan Chargers | 23.96 | 8.29 | 23.84 | 7.90 | 22.32 | 8.15 |
| Kolkata Knight Riders | 22.06 | 7.79 | 24.40 | 7.20 | 26.02 | 7.31 |
| Chennai Super Kings | 31.88 | 8.44 | 27.54 | 8.10 | 29.31 | 8.15 |
| Kings XI Punjab | 31.18 | 8.81 | 22.16 | 7.19 | 20.44 | 7.93 |
Among the bowling units, the averages for Deccan and Bangalore have improved considerably over the first. Punjab, though, have struggled for wickets, with their average being the highest among all teams.
| Team | 2008 - Average | Econ rate | 2009 - Average | Econ rate | 2010 - Average | Econ rate |
| Mumbai Indians | 22.29 | 8.05 | 22.24 | 7.23 | 25.27 | 8.34 |
| Delhi Daredevils | 23.15 | 8.34 | 20.35 | 7.54 | 21.08 | 8.19 |
| Royal Challengers Bangalore | 33.90 | 8.42 | 26.31 | 7.51 | 26.00 | 7.71 |
| Rajasthan Royals | 22.04 | 7.89 | 21.04 | 7.02 | 26.71 | 8.36 |
| Deccan Chargers | 34.35 | 8.70 | 21.70 | 7.52 | 24.82 | 8.36 |
| Kolkata Knight Riders | 24.54 | 8.05 | 33.16 | 7.87 | 29.56 | 7.89 |
| Chennai Super Kings | 27.61 | 8.42 | 22.02 | 7.54 | 26.20 | 8.27 |
| Kings XI Punjab | 25.44 | 8.54 | 24.81 | 7.58 | 32.05 | 8.58 |
The Powerplay stars
And now here's a closer look at some of the key stats from IPL 2010. We start with team and individual performances in the Powerplay overs (other aspects will be examined in subsequent articles over the next couple of weeks).
Mumbai have been absolute champions in the first six overs with the bat, with Sachin Tendulkar leading the way quite emphatically (more details on that in the next table). They've averaged almost nine-and-a-half runs per over, and more than 66 runs per wicket in these overs. Deccan and Delhi have been the other teams to average nine-plus with the bat, thanks to Adam Gilchrist, Virender Sehwag and David Warner. Deccan have been especially good with both bat and ball in the first six, averaging an economy rate of a shade over seven - the difference between their batting and bowling run rates is more than two, which suggests they've been pretty ordinary through the rest of the overs - to finish with three wins and as many losses in the first six matches. Bangalore have an exceptionally high average in the first six, thanks to their top-notch old guard, Jacques Kallis.
On the other hand, Rajasthan and Punjab have struggled to take charge in the first six. Rajasthan have conceded more than 50 runs seven times in eight matches, with three of those being above 60. Two of those are the highest conceded in the tournament so far - they gave away 76 against the otherwise abject Punjab, and 69 against Mumbai. Punjab have struggled to take wickets in the first six, which has hurt them quite badly - they concede almost 50 runs per wicket, which is much higher than their batting average.
| Team | Batting average | Batting run rate | Bowling average | Economy rate | Ave diff | RR diff |
| Mumbai Indians | 66.33 | 9.47 | 30.90 | 8.09 | 35.43 | 1.38 |
| Deccan Chargers | 27.25 | 9.08 | 19.46 | 7.02 | 7.79 | 2.06 |
| Delhi Daredevils | 28.86 | 9.02 | 22.47 | 7.95 | 6.39 | 1.07 |
| Royal Challengers Bangalore | 67.00 | 7.97 | 56.00 | 8.00 | 11.00 | -0.03 |
| Rajasthan Royals | 26.92 | 7.85 | 42.45 | 9.72 | -15.53 | -1.87 |
| Kings XI Punjab | 27.08 | 7.73 | 49.42 | 8.23 | -22.34 | -0.50 |
| Chennai Super Kings | 35.70 | 7.43 | 40.30 | 8.39 | -4.60 | -0.96 |
| Kolkata Knight Riders | 23.76 | 7.35 | 27.83 | 7.95 | -4.07 | -0.60 |
Not surprisingly, Tendulkar is right on top of the run-scorers' list in the first six. He's made 163 of his 314 runs - that's more than 50% - during the Powerplay overs. He has only been dismissed once during this period, which gives him an exceptional average of 163, and those runs have come at a rate of 9.40 per over. Kallis follows, with an average that's almost as good, though the strike rate is quite a bit lower. Sehwag, Gilchrist and Warner are the others with a strike rate of 10 or more runs per over, while Murali Vijay has crept into the top 10 too, thanks to his superb knock against Bangalore.
| Batsman | Runs | Balls | Dismissals | Average | Run rate |
| Sachin Tendulkar | 163 | 104 | 1 | 163.00 | 9.40 |
| Jacques Kallis | 158 | 126 | 1 | 158.00 | 7.52 |
| Virender Sehwag | 157 | 91 | 5 | 31.40 | 10.35 |
| Naman Ojha | 149 | 108 | 5 | 29.80 | 8.27 |
| Matthew Hayden | 144 | 109 | 4 | 36.00 | 7.92 |
| Adam Gilchrist | 133 | 70 | 5 | 26.60 | 11.40 |
| Manish Pandey | 120 | 99 | 2 | 60.00 | 7.27 |
| David Warner | 120 | 72 | 3 | 40.00 | 10.00 |
| Michael Lumb | 110 | 78 | 3 | 36.67 | 8.46 |
| Murali Vijay | 99 | 65 | 1 | 99.00 | 9.13 |
Among the bowlers, Chaminda Vaas has been outstanding, which makes his omission from the team quite inexplicable. He has bowled 72 deliveries in the Powerplay overs, and taken seven wickets at an average of 8.14 and an economy rate of 4.75. All of that has been achieved with clever changes of pace, length, and some swing. Dirk Nannes has an excellent economy rate too, but he has only managed two wickets in 78 deliveries.
| Bowler | Balls bowled | Runs conceded | Wickets | Average | Econ rate |
| Chaminda Vaas | 72 | 57 | 7 | 8.14 | 4.75 |
| Dirk Nannes | 78 | 64 | 2 | 32.00 | 4.92 |
| Lasith Malinga | 54 | 54 | 4 | 13.50 | 6.00 |
| Praveen Kumar | 84 | 100 | 1 | 100.00 | 7.14 |
| Albie Morkel | 84 | 107 | 3 | 35.67 | 7.64 |
| Ryan McLaren | 60 | 78 | 1 | 78.00 | 7.80 |
| Zaheer Khan | 78 | 102 | 2 | 51.00 | 7.84 |
| Sreesanth | 60 | 79 | 3 | 26.33 | 7.90 |
S Rajesh is stats editor of Cricinfo