Chris Gayle sets benchmark
An analysis of performances in the World Cup after the record-breaking innings by Chris Gayle.
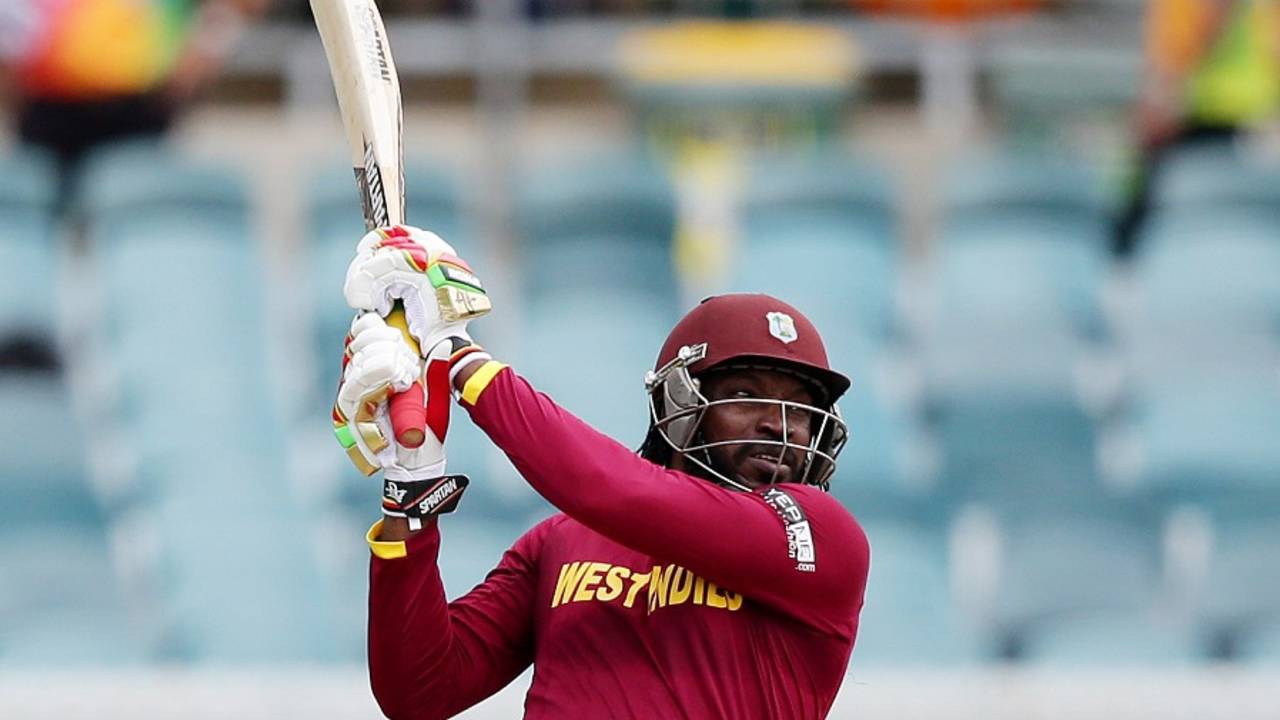
Chris Gayle displaced Shikhar Dhawan as the batsman with the leading performance so far with his record-breaking 215 against Zimbabwe. • Associated Press
This analysis will be done at suitable points during the World Cup 2015 so that the readers can see the way the Performance tables evolve. As more matches get played the top performance mosaic changes and readers can identify with what happened in the past few days. The qualifying bar for inclusion moves higher as more matches get played.
Two teams which had fallen flat in their earlier matches came back to form with resounding victories. Each was powered by two left-handed openers coming out with contrasting centuries, one of these breaking about ten records. All in all, it was business as usual.
| SNo | Rating Pts | Year | ODI# | Batsman | For | Vs | Runs | Balls |
|---|---|---|---|---|---|---|---|---|
| 1 | 572 | 2015 | 3612 | CH Gayle | West Indies | Zim | 215 | 147 |
| 2 | 460 | 2015 | 3610 | S Dhawan | India | Saf | 137 | 146 |
| 3 | 397 | 2015 | 3601 | DA Miller | South Africa | Zim | 138* | 92 |
| 4 | 386 | 2015 | 3600 | JWA Taylor | England | Aus | 98* | 90 |
| 5 | 370 | 2015 | 3600 | AJ Finch | Australia | Eng | 135 | 128 |
| 6 | 363 | 2015 | 3607 | BB McCullum | New Zealand | Eng | 77 | 25 |
| 7 | 345 | 2015 | 3611 | MM Ali | England | Sco | 128 | 107 |
| 8 | 316 | 2015 | 3609 | DPMD Jayawardene | Sri Lanka | Afg | 100 | 120 |
| 9 | 314 | 2015 | 3601 | JP Duminy | South Africa | Zim | 115* | 100 |
| 10 | 290 | 2015 | 3602 | V Kohli | India | Pak | 107 | 126 |
If Chris Gayle's blockbuster double-hundred did not move to the top of the tables, I would have had a lot of explaining to do. But Gayle's 215 secured 572 rating pts and moved emphatically to the top. Couple of days back I had mentioned that it would require something special to knock Shikhar Dhawan off the top. Well, let us see: The highest individual score in World Cups, the only non-Indian double hundred, share of the 16-sixes in an innings record, fastest 200 ever, leading partner of the highest ever partnership in ODIs and finally an effective answer to everyone, especially Mr. Dave Cameron.
Moeen Ali's less powerful but top quality match winning century got 345 rating pts and moved to seventh position in the batting performance table. Those fifties and lesser hundreds have slowly started moving off the bottom of the table.
| SNo | Rating Pts | Year | ODI# | Bowler | For | Vs | Analysis |
|---|---|---|---|---|---|---|---|
| 1 | 606 | 2015 | 3607 | TG Southee | New Zealand | Eng | 9.0 - 0 - 33 - 7 |
| 2 | 452 | 2015 | 3600 | MR Marsh | Australia | Eng | 9.0 - 0 - 33 - 5 |
| 3 | 429 | 2015 | 3602 | Sohail Khan | Pakistan | Ind | 10.0 - 0 - 55 - 5 |
| 4 | 321 | 2015 | 3608 | JE Taylor | West Indies | Pak | 7.0 - 1 - 15 - 3 |
| 5 | 311 | 2015 | 3600 | ST Finn | England | Aus | 10.0 - 0 - 71 - 5 |
| 6 | 286 | 2015 | 3602 | Mohammed Shami | India | Pak | 9.0 - 1 - 35 - 4 |
| 7 | 242 | 2015 | 3611 | JH Davey | Scotland | Eng | 10.0 - 0 - 68 - 4 |
| 8 | 221 | 2015 | 3605 | Mashrafe Mortaza | Bangladesh | Afg | 9.0 - 2 - 20 - 3 |
| 9 | 212 | 2015 | 3603 | GH Dockrell | Ireland | Win | 10.0 - 0 - 50 - 3 |
| 10 | 210 | 2015 | 3612 | JE Taylor | West Indies | Zim | 10.0 - 0 - 38 - 3 |
The only stand-out bowling performance was Josh Davey's spell of 4 for 68 against England. He captured four-middle order wickets, secured 242 rating pts and moved to the seventh position. Jerome Taylor's very effective spell of 3 for 38 took him to the tenth position in the bowling table. Let us not forget that Taylor has two entries in the bowling table.
| SNo | Rating Pts | Year | ODI# | Player | For | Vs | Runs | Balls | Analysis |
|---|---|---|---|---|---|---|---|---|---|
| 1 | 700 | 2015 | 3612 | CH Gayle | West Indies | Zim | 215 | 147 | 6.0-0-35-2 |
| 2 | 504 | 2015 | 3600 | MR Marsh | Australia | Eng | 23 | 20 | 9.0-0-33-5 |
| 3 | 434 | 2015 | 3611 | MM Ali | England | Sco | 128 | 107 | 10.0-0-47-2 |
| 4 | 353 | 2015 | 3608 | AD Russell | West Indies | Pak | 42* | 13 | 8.0-2-33-3 |
| 5 | 297 | 2015 | 3606 | SC Williams | Zimbabwe | Uae | 76* | 65 | 8.0-0-43-2 |
| 6 | 281 | 2015 | 3599 | CJ Anderson | New Zealand | Slk | 75 | 46 | 3.1-0-18-2 |
| 7 | 249 | 2015 | 3609 | AD Mathews | Sri Lanka | Afg | 44 | 81 | 7.0-0-41-3 |
| 8 | 248 | 2015 | 3605 | Shakib Al Hasan | Bangladesh | Afg | 63 | 51 | 8.5-0-43-2 |
It would have required an immense all-round performance to unseat Mitchell Marsh from the top of the player performance table. And Gayle did exactly that. He followed up his explosive 215 with two wickets and a catch. His total of 700 rating points was nearly 200 rating points ahead of Mitchell Marsh and is likely to be in the top-three at the end of the World Cup. Moeen Ali also did the all-round act very well. He captured two wickets, accumulated 434 rating pts and moved into the fourth position, ahead of Andre Russell.
| SNo | Rating Pts | Year | ODI# | Team | Own score | Vs | Other score |
|---|---|---|---|---|---|---|---|
| 1 | 713 | 2015 | 3607 | New Zealand | 125 for 2 in 12.2 | Eng | 123 for 10 in 33.2 |
| 2 | 691 | 2015 | 3610 | India | 307 for 7 in 50.0 | Saf | 177 for 10 in 40.2 |
| 3 | 664 | 2015 | 3608 | West Indies | 310 for 6 in 50.0 | Pak | 160 for 10 in 39.0 |
| 4 | 640 | 2015 | 3605 | Bangladesh | 267 for 10 in 50.0 | Afg | 162 for 10 in 42.5 |
| 5 | 626 | 2015 | 3611 | England | 303 for 8 in 50.0 | Sco | 184 for 10 in 42.2 |
| 6 | 598 | 2015 | 3612 | West Indies | 372 for 2 in 50.0 | Zim | 289 for 10 in 44.3 |
| 7 | 596 | 2015 | 3599 | New Zealand | 331 for 6 in 50.0 | Slk | 233 for 10 in 46.1 |
| 8 | 596 | 2015 | 3600 | Australia | 342 for 9 in 50.0 | Eng | 231 for 10 in 41.5 |
| 9 | 592 | 2015 | 3602 | India | 300 for 7 in 50.0 | Pak | 224 for 10 in 47.0 |
| 10 | 591 | 2015 | 3603 | Ireland | 307 for 6 in 45.5 | Win | 304 for 7 in 50.0 |
There are no major changes to the team table. England entered in the fifth position with their comprehensive win over Scotland, securing 625 rating pts. West Indies could only join them in the sixth position since they won only by 73 runs, only around 20% of the final target.
A brief introduction into the methodology of Performance Analysis.
The Batting Performance Ratings analysis takes into account the Runs scored, Balls faced, Next highest score (if this is the highest score), % of Team score, Innings status at entry, Bowling quality, Pitch information, Team strengths, Target score in front, Match location, Result and Match importance. These parameters are given appropriate weights. The calculations are done in such a way that Rating points of 1000 would be allotted to a mind-blowing and match-winning score of 200 in 150 balls in a WC final.
The Bowling Performance Ratings analysis takes into account the Wickets captured, Quality of batsmen dismissed, Scores at which batsmen were dismissed, Bowling accuracy, Batting quality, Pitch information, Team strengths, Target being defended, Match location, Result and Match importance. The calculations are done in such a way that Rating points of 1000 would be allotted to a magnificent and match-winning analysis of 10-2-15-6 in a WC final.
The Player Performance Ratings analysis takes into account the Batting Rating points, Bowling Rating points and the Fielding Rating points, which is a combination of catches and stumpings. There are minimum criteria for batting and bowling stints to ensure that these are genuinely all-round performances.
The Team Performance Ratings analysis takes into account the Result, Margin of win, Resources utilized, Team strengths, Match location and Match importance. The calculations are done in such a way that Rating points of 1000 would be allotted to an overwhelming win by 150 runs or 8 wickets in a WC final.
Anantha Narayanan has written for ESPNcricinfo and CastrolCricket and worked with a number of companies on their cricket performance ratings-related systems