Dilshan's innings a close third
An analysis of performances in the World Cup after the first-17 matches in the World Cup
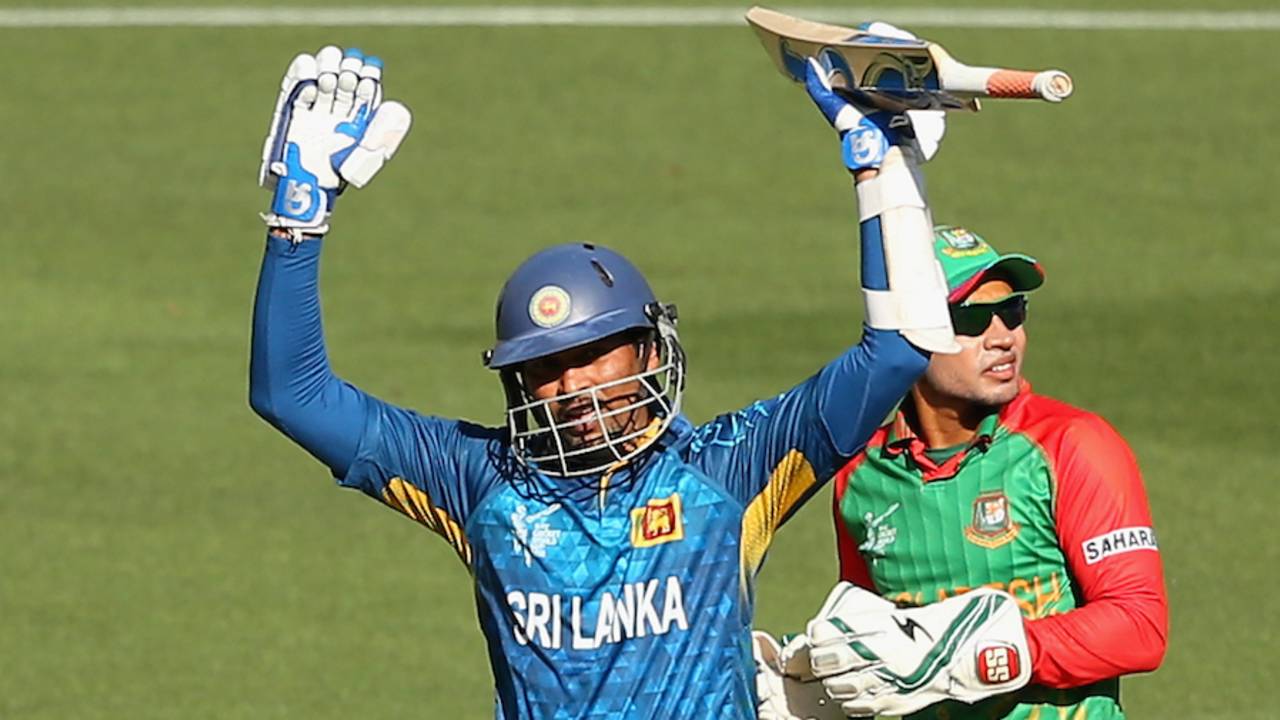
Tillkaratne Dilshan's unbeaten 161 and two wickets against Bangladesh earned him the second position in allrounders' table • Getty Images
This analysis will be done at suitable points during the World Cup 2015 so that the readers can see the way the Performance tables evolve. As more matches get played the top performance mosaic changes and readers can identify with what happened in the past few days. The qualifying bar for inclusion moves higher as more matches get played.
Three matches were played since the last report was prepared. Two of these resulted in last over cliff-hangers and the two losing teams could as well have won the matches. The fact that these four teams are the associate teams should throw big questions on ICC's self-limiting exclusive strategy for the next World Cup. But it is unlikely that this policy would be changed since money rules. The third match was yet another of these 3xx-2xx matches of which this World Cup has already seen six.
| SNo | Rating Pts | Year | ODI# | Batsman | For | Vs | Runs | Balls |
|---|---|---|---|---|---|---|---|---|
| 1 | 572 | 2015 | 3612 | CH Gayle | West Indies | Zim | 215 | 147 |
| 2 | 460 | 2015 | 3610 | S Dhawan | India | Saf | 137 | 146 |
| 3 | 460 | 2015 | 3615 | TM Dilshan | Sri Lanka | Bng | 161* | 146 |
| 4 | 397 | 2015 | 3601 | DA Miller | South Africa | Zim | 138* | 92 |
| 5 | 389 | 2015 | 3613 | Shaiman Anwar | U.A.E. | Ire | 106 | 83 |
| 6 | 386 | 2015 | 3600 | JWA Taylor | England | Aus | 98* | 90 |
| 7 | 370 | 2015 | 3600 | AJ Finch | Australia | Eng | 135 | 128 |
| 8 | 363 | 2015 | 3607 | BB McCullum | New Zealand | Eng | 77 | 25 |
| 9 | 351 | 2015 | 3614 | Samiullah Shenwari | Afghanistan | Sco | 96 | 147 |
| 10 | 345 | 2015 | 3611 | MM Ali | England | Sco | 128 | 107 |
The table is becoming quite tight now. So much so, Kumar Sangakkara's lovely hundred could not even find a place in the top ten. Tillakaratne Dilshan's huge innings got into the table in the third position, with 460 rating pts: Dead-heated with Shikhar Dhawan. Shaiman Anwar's beautifully crafted 106 came in at the fifth position. It is clear that this innings is identical to that of Sangakkara. However Anwar came in to bat at a disastrous situation and scored most of his runs in the company of low order batsmen. If UAE had won, this could easily be in the top three.
I am indeed very happy that Samiullah Shenwari's brave innings found a place in the top ten. The slow rate of scoring was more than made up by the over 100 runs scored for the eighth and ninth wickets. However this could very well leave the table next time around.
| SNo | Rating Pts | Year | ODI# | Bowler | For | Vs | Analysis |
|---|---|---|---|---|---|---|---|
| 1 | 606 | 2015 | 3607 | TG Southee | New Zealand | Eng | 9.0 - 0 - 33 - 7 |
| 2 | 452 | 2015 | 3600 | MR Marsh | Australia | Eng | 9.0 - 0 - 33 - 5 |
| 3 | 429 | 2015 | 3602 | Sohail Khan | Pakistan | Ind | 10.0 - 0 - 55 - 5 |
| 4 | 321 | 2015 | 3608 | JE Taylor | West Indies | Pak | 7.0 - 1 - 15 - 3 |
| 5 | 311 | 2015 | 3600 | ST Finn | England | Aus | 10.0 - 0 - 71 - 5 |
| 6 | 286 | 2015 | 3602 | Mohammed Shami | India | Pak | 9.0 - 1 - 35 - 4 |
| 7 | 266 | 2015 | 3614 | Shapoor Zadran | Afghanistan | Sco | 10.0 - 1 - 38 - 4 |
| 8 | 258 | 2015 | 3614 | Dawlat Zadran | Afghanistan | Sco | 10.0 - 1 - 29 - 3 |
| 9 | 249 | 2015 | 3614 | RD Berrington | Scotland | Afg | 10.0 - 0 - 40 - 4 |
| 10 | 242 | 2015 | 3611 | JH Davey | Scotland | Eng | 10.0 - 0 - 68 - 4 |
Three bowling performances from the close Afghanistan-Scotland encounter found their places in the lower half of the table. It is clear that top quality bowling performances are at a premium in this batting-dominated World Cup. But these are all in for short reigns.
| SNo | Rating Pts | Year | ODI# | Player | For | Vs | Runs | Balls | Analysis |
|---|---|---|---|---|---|---|---|---|---|
| 1 | 700 | 2015 | 3612 | CH Gayle | West Indies | Zim | 215 | 147 | 6.0-0-35-2 |
| 2 | 579 | 2015 | 3615 | TM Dilshan | Sri Lanka | Bng | 161* | 146 | 8.0-0-35-2 |
| 3 | 504 | 2015 | 3600 | MR Marsh | Australia | Eng | 23 | 20 | 9.0-0-33-5 |
| 4 | 434 | 2015 | 3611 | MM Ali | England | Sco | 128 | 107 | 10.0-0-47-2 |
| 5 | 353 | 2015 | 3608 | AD Russell | West Indies | Pak | 42* | 13 | 8.0-2-33-3 |
| 6 | 317 | 2015 | 3614 | RD Berrington | Scotland | Afg | 25 | 46 | 10.0-0-40-4 |
| 7 | 298 | 2015 | 3606 | SC Williams | Zimbabwe | Uae | 76* | 65 | 8.0-0-43-2 |
| 8 | 298 | 2015 | 3613 | Amjad Javed | U.A.E. | Ire | 42 | 35 | 10.0-0-60-3 |
| 9 | 281 | 2015 | 3599 | CJ Anderson | New Zealand | Slk | 75 | 46 | 3.1-0-18-2 |
| 10 | 258 | 2015 | 3614 | AC Evans | Scotland | Afg | 28 | 37 | 10.0-1-30-2 |
Dilshan, like Gayle, followed up his mammoth batting effort with a very useful bowling stint. This gave him another 119 rating pts and got him into the second place. Richie Berrington and Alasdair Evans also got in with useful all-round performances in the match lost to Afghanistan. Similarly Amjad Javed with his excellent low order 40 and three wickets, also gets in. However note how fast the rating points drop off. From 700 at the top to 300 at the sixth place.
| SNo | Rating Pts | Year | ODI# | Team | Own score | Vs | Other score |
|---|---|---|---|---|---|---|---|
| 1 | 713 | 2015 | 3607 | New Zealand | 125 for 2 in 12.2 | Eng | 123 for 10 in 33.2 |
| 2 | 691 | 2015 | 3610 | India | 307 for 7 in 50.0 | Saf | 177 for 10 in 40.2 |
| 3 | 664 | 2015 | 3608 | West Indies | 310 for 6 in 50.0 | Pak | 160 for 10 in 39.0 |
| 4 | 640 | 2015 | 3605 | Bangladesh | 267 for 10 in 50.0 | Afg | 162 for 10 in 42.5 |
| 5 | 626 | 2015 | 3611 | England | 303 for 8 in 50.0 | Sco | 184 for 10 in 42.2 |
| 6 | 626 | 2015 | 3615 | Sri Lanka | 332 for 1 in 50.0 | Bng | 240 for 10 in 47.0 |
| 7 | 598 | 2015 | 3612 | West Indies | 372 for 2 in 50.0 | Zim | 289 for 10 in 44.3 |
| 8 | 596 | 2015 | 3600 | Australia | 342 for 9 in 50.0 | Eng | 231 for 10 in 41.5 |
| 9 | 596 | 2015 | 3599 | New Zealand | 331 for 6 in 50.0 | Slk | 233 for 10 in 46.1 |
| 10 | 592 | 2015 | 3602 | India | 300 for 7 in 50.0 | Pak | 224 for 10 in 47.0 |
Sri Lanka's comfortable win over Bangladesh enters the table in the sixth place. Ireland got 509 rating pts for their close win over UAE, which secured 446 rating pts.
A brief introduction into the methodology of Performance Analysis.
The Batting Performance Ratings analysis takes into account the Runs scored, Balls faced, Next highest score (if this is the highest score), % of Team score, Innings status at entry, Bowling quality, Pitch information, Team strengths, Target score in front, Match location, Result and Match importance. These parameters are given appropriate weights. The calculations are done in such a way that Rating points of 1000 would be allotted to a mind-blowing and match-winning score of 200 in 150 balls in a WC final.
The Bowling Performance Ratings analysis takes into account the Wickets captured, Quality of batsmen dismissed, Scores at which batsmen were dismissed, Bowling accuracy, Batting quality, Pitch information, Team strengths, Target being defended, Match location, Result and Match importance. The calculations are done in such a way that Rating points of 1000 would be allotted to a magnificent and match-winning analysis of 10-2-15-6 in a WC final.
The Player Performance Ratings analysis takes into account the Batting Rating points, Bowling Rating points and the Fielding Rating points, which is a combination of catches and stumpings. There are minimum criteria for batting and bowling stints to ensure that these are genuinely all-round performances.
The Team Performance Ratings analysis takes into account the Result, Margin of win, Resources utilized, Team strengths, Match location and Match importance. The calculations are done in such a way that Rating points of 1000 would be allotted to an overwhelming win by 150 runs or 8 wickets in a WC final.
Anantha Narayanan has written for ESPNcricinfo and CastrolCricket and worked with a number of companies on their cricket performance ratings-related systems