Recent form favours South Africa
South Africa are favourites based on recent form, but West Indies can draw inspiration from their excellent performances in global tournaments against South Africa
Madhusudhan Ramakrishnan
23-Feb-2011
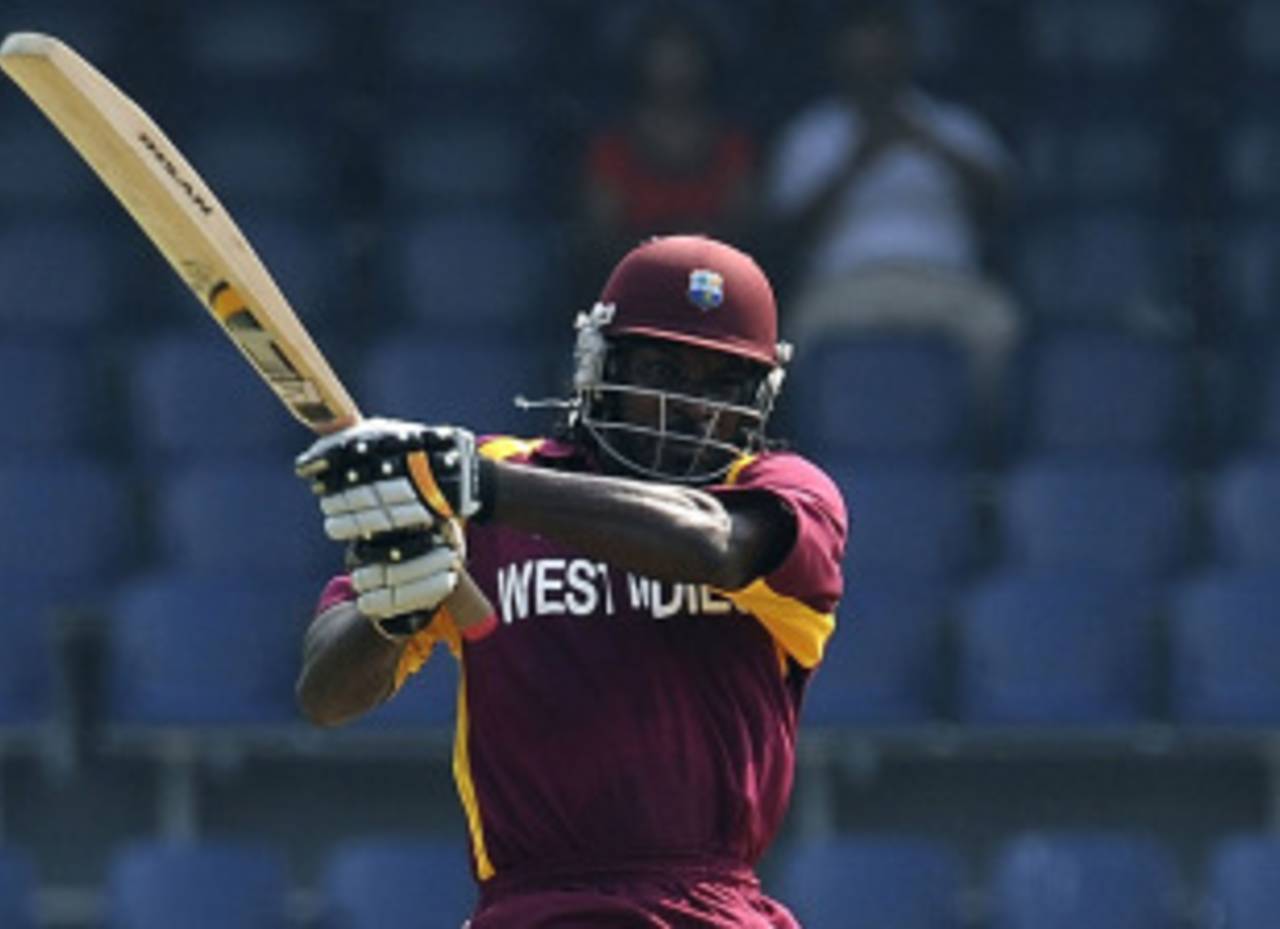
Chris Gayle: centuries in all three formats against South Africa • AFP
Going by recent form, South Africa are firm favourites going into their first match of the World Cup, against West Indies. South Africa have won 26 of the 39 matches played since the beginning of 2009 and along with Australia, have the best win-loss ratio in the same period. Their only series defeats since 2009 have come against England and India, and their biggest disappointment was the failure to make the semi-finals of the Champions Trophy in 2009. West Indies, on the other hand, have won just 10 matches and lost 27 since the beginning of 2009, and have the worst win-loss ratio among Test-playing teams. Their last series win against a Test-playing team came in the home series against Sri Lanka in 2007-08. However, what makes the match-up interesting is that West Indies have almost always found a way to compete against South Africa in global tournaments, where they have won four out of the eight matches played between the two sides.
Head-to-head record
South Africa have beaten West Indies in their last eleven meetings since the Champions Trophy in 2006. However, West Indies can draw confidence from their record against South Africa in global tournaments. While Brian Lara's superb centuries in Karachi and Cape Town gave them victories in the 1996 and 2003 World Cup matches, it was Chris Gayle's aggressive 133 which led to a convincing six-wicket win in the Champions Trophy match in Jaipur in 2006. South Africa, though, boosted by AB de Villiers' 146, won comfortably on the last occasion the teams met in the World Cup, in 2007. In the subcontinent, South Africa have a better record, having won four out of six matches played between the two teams. Since 2000, however, West Indies are one of only three teams to boast a positive win-loss record in ODIs in India.
South Africa have beaten West Indies in their last eleven meetings since the Champions Trophy in 2006. However, West Indies can draw confidence from their record against South Africa in global tournaments. While Brian Lara's superb centuries in Karachi and Cape Town gave them victories in the 1996 and 2003 World Cup matches, it was Chris Gayle's aggressive 133 which led to a convincing six-wicket win in the Champions Trophy match in Jaipur in 2006. South Africa, though, boosted by AB de Villiers' 146, won comfortably on the last occasion the teams met in the World Cup, in 2007. In the subcontinent, South Africa have a better record, having won four out of six matches played between the two teams. Since 2000, however, West Indies are one of only three teams to boast a positive win-loss record in ODIs in India.
| Played | Won | Lost | |
| Overall | 50 | 12 | 37 |
| Home | 21 | 5 | 16 |
| Away/Neutral | 29 | 7 | 21 |
| Global tournaments | 8 | 4 | 4 |
| In subcontinent | 6 | 2 | 4 |
| Since Jan 2008 | 10 | 0 | 10 |
South Africa's batting dominance
Since January 2008, South Africa have a batting average of 37.42, the best among all teams that have played at least 50 matches. In contrast, West Indies average just 25.73. While South African batsmen have made 111 fifty-plus scores in 56 matches, West Indies have just 69 fifty-plus scores in 61 matches. South Africa's record against West Indies is even more impressive; in ten ODIs since the beginning of 2008, they average 42.94 with five centuries. West Indian batsmen, on the other hand, have not scored a single century and average just 25.94. Jacques Kallis, de Villiers and Hashim Amla average over 50 in the last three years in matches against West Indies. Amla especially, has been exceptional scoring over 400 runs in five matches with two centuries and one half-century. Shivnarine Chanderpaul, who averages nearly 44, has been the solitary success for West Indies in recent head-to-head matches against South Africa. Gayle, who is the only player to score a century against South Africa in all three formats, has had a very poor time since 2008. In five matches against South Africa, he has scored just 128 runs without a single half-century.
Since January 2008, South Africa have a batting average of 37.42, the best among all teams that have played at least 50 matches. In contrast, West Indies average just 25.73. While South African batsmen have made 111 fifty-plus scores in 56 matches, West Indies have just 69 fifty-plus scores in 61 matches. South Africa's record against West Indies is even more impressive; in ten ODIs since the beginning of 2008, they average 42.94 with five centuries. West Indian batsmen, on the other hand, have not scored a single century and average just 25.94. Jacques Kallis, de Villiers and Hashim Amla average over 50 in the last three years in matches against West Indies. Amla especially, has been exceptional scoring over 400 runs in five matches with two centuries and one half-century. Shivnarine Chanderpaul, who averages nearly 44, has been the solitary success for West Indies in recent head-to-head matches against South Africa. Gayle, who is the only player to score a century against South Africa in all three formats, has had a very poor time since 2008. In five matches against South Africa, he has scored just 128 runs without a single half-century.
| Batsman | Team | Matches | Runs | Average | Strike rate | 100 | 50 |
| Jacques Kallis | South Africa | 10 | 452 | 56.50 | 89.32 | 1 | 4 |
| AB de Villiers | South Africa | 10 | 425 | 53.12 | 89.47 | 1 | 3 |
| Hashim Amla | South Africa | 5 | 402 | 80.40 | 101.25 | 2 | 1 |
| Shivnarine Chanderpaul | West Indies | 7 | 307 | 43.85 | 64.49 | 0 | 4 |
| Dwayne Bravo | West Indies | 10 | 252 | 25.20 | 84.28 | 0 | 1 |
| Chris Gayle | West Indies | 5 | 128 | 25.60 | 90.78 | 0 | 0 |
Bowling experience the key
Dale Steyn, the best fast bowler in Tests over the last few years, has been less effective in ODIs. He has picked up 58 wickets at an average of nearly 30 since the beginning of 2008. Surprisingly, his record against West Indies is poor: he has just eight wickets in seven matches at an average of 39.25. Morne Morkel has been much more impressive, with 53 wickets at 24.18. He has picked up 18 wickets in his last seven matches against West Indies with two four-wicket hauls. Lonwabo Tsotsobe lends variety to the pace attack, while the consistent Johan Botha has led the spin attack well over the last few years. With legspinner Imran Tahir showing plenty of promise, South Africa's attack has lots of class and variety.
Dale Steyn, the best fast bowler in Tests over the last few years, has been less effective in ODIs. He has picked up 58 wickets at an average of nearly 30 since the beginning of 2008. Surprisingly, his record against West Indies is poor: he has just eight wickets in seven matches at an average of 39.25. Morne Morkel has been much more impressive, with 53 wickets at 24.18. He has picked up 18 wickets in his last seven matches against West Indies with two four-wicket hauls. Lonwabo Tsotsobe lends variety to the pace attack, while the consistent Johan Botha has led the spin attack well over the last few years. With legspinner Imran Tahir showing plenty of promise, South Africa's attack has lots of class and variety.
In the absence of the injured Jerome Taylor and Fidel Edwards, the West Indian pace attack is led by Kemar Roach and Ravi Rampaul. Dwayne Bravo, the highest wicket-taker for West Indies since 2008, and Darren Sammy complete the pace line-up. Despite the presence of spinners like Sulieman Benn and Nikita Miller, the bowling attack overall lacks the experience and firepower that South Africa possess.
First ten and last ten overs
South Africa have been the superior batting side, scoring at a higher run-rate and averaging higher than West Indies in the mandatory Powerplay overs and the last ten overs. When the bowling performance is analysed, West Indies have a slightly better economy rate in both the first ten and last ten overs. Overall though, the run-rate difference is significantly better for South Africa.
South Africa have been the superior batting side, scoring at a higher run-rate and averaging higher than West Indies in the mandatory Powerplay overs and the last ten overs. When the bowling performance is analysed, West Indies have a slightly better economy rate in both the first ten and last ten overs. Overall though, the run-rate difference is significantly better for South Africa.
| Team | Overs | Runs scored | Run rate | Wickets lost | Batting avg | Runs Conceded | Economy rate | Wickets taken | Bowling avg | Run rate difference |
| South Africa | 1-10 | 2144 | 5.49 | 38 | 56.42 | 1835 | 5.07 | 51 | 35.98 | 0.42 |
| West Indies | 1-10 | 1808 | 4.77 | 58 | 31.17 | 1876 | 4.70 | 44 | 42.63 | 0.07 |
| South Africa | 41-50 | 2194 | 7.85 | 90 | 24.37 | 1960 | 7.46 | 103 | 19.02 | 0.39 |
| West Indies | 41-50 | 1339 | 7.31 | 75 | 17.85 | 1664 | 7.18 | 78 | 21.33 | 0.13 |
Delhi, the venue for the game, has hosted just five ODIs since 2000. Three of those matches were won by the team batting first, but India won the only day-night game by six wickets against Australia in 2009. The most recent match in Delhi - between India and Sri Lanka in December 2009 - however, ended abruptly as the pitch was deemed dangerous for play to continue. The focus will thus be as much on the pitch as the teams on Thursday.