Flop show by Sri Lanka's batsmen and seamers
Australia's fast bowlers took 48 wickets at 21.75, compared to Sri Lanka's 19 at 59.47, while the home team batsmen averaged 46 per wicket compared to the visitors' 25
S Rajesh
07-Jan-2013
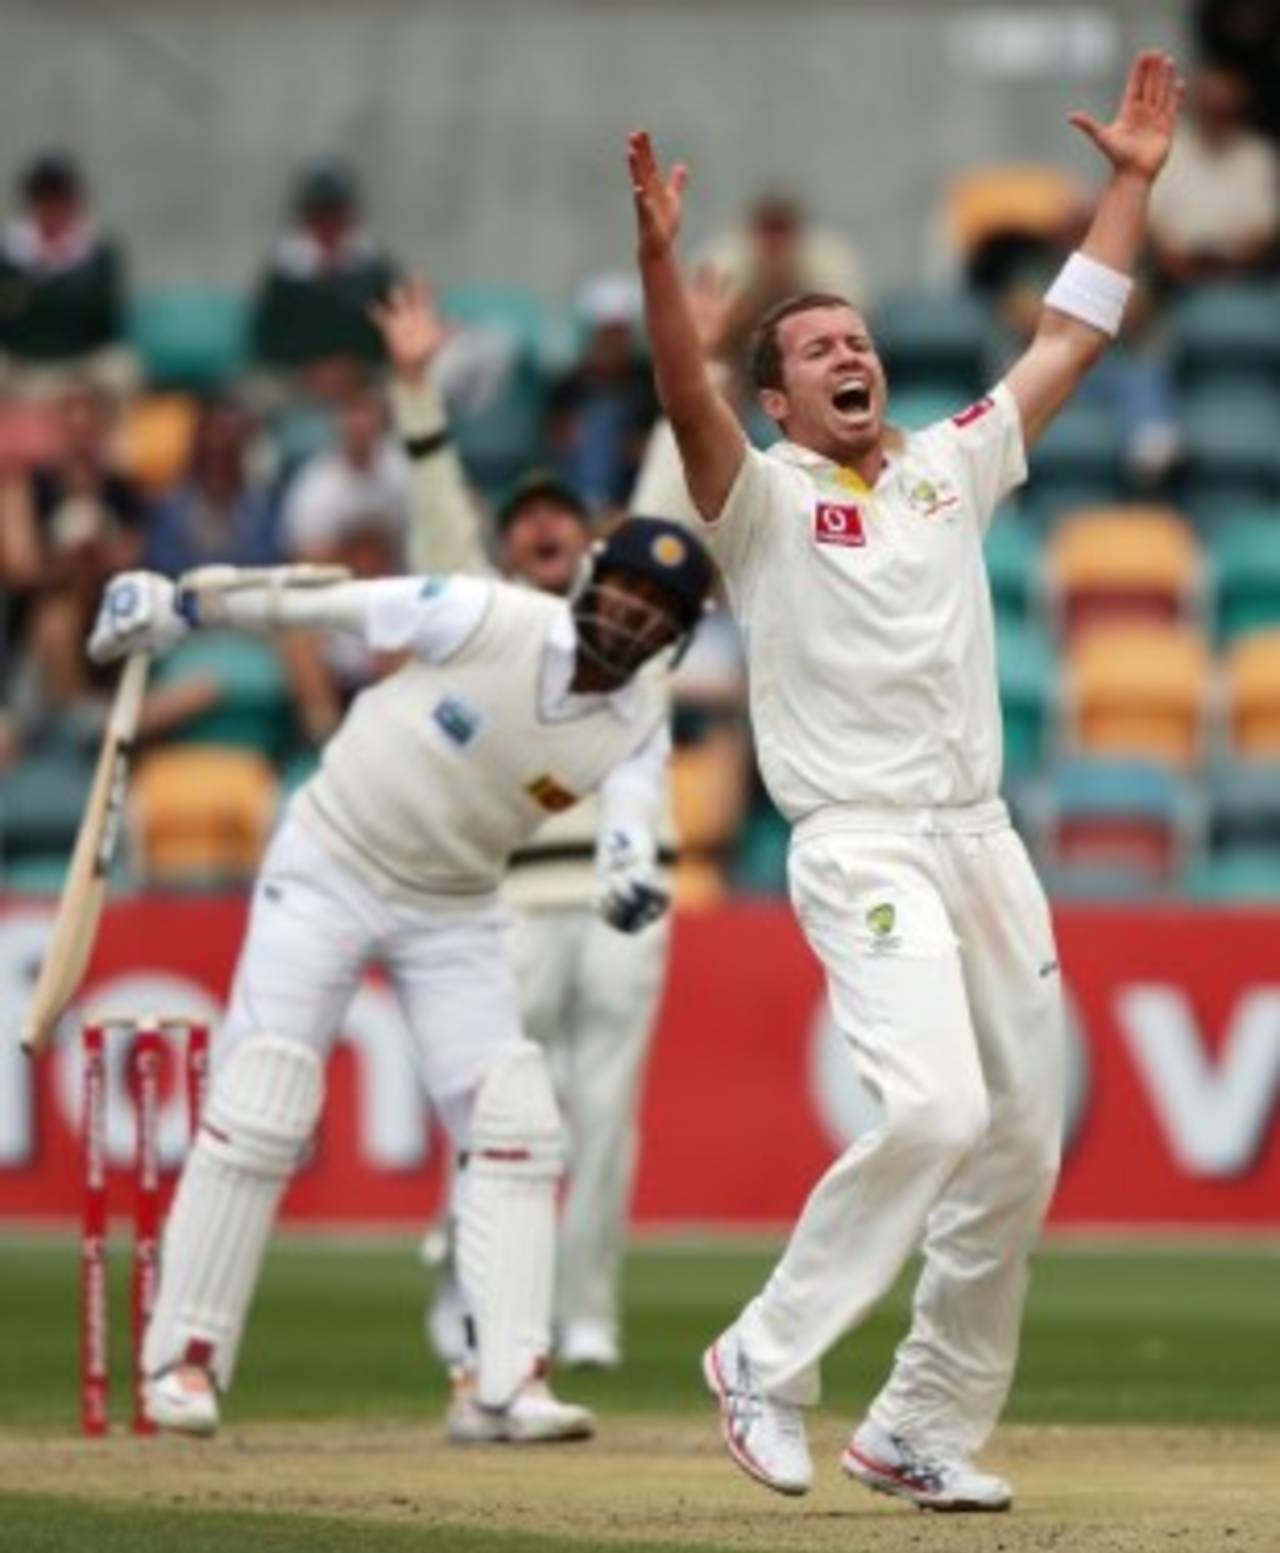
Peter Siddle was the highest wicket-taker in the series, and also did splendidly against most of the Sri Lankan top-order batsmen • Getty Images
For the third time in six three-Test series between these two teams, Australia blanked Sri Lanka 3-0 - the two earlier instances were in Australia in 1995-96, and in Sri Lanka in 2003-04. Leaving aside matches involving Zimbabwe and Bangladesh, no rivalry in Test cricket has been as lopsided as this one, in terms of results: Australia have won 17, Sri Lanka 1. The next-best win-loss ratio is England's 5.62 against New Zealand.
This time Australia were coming off a disappointing series defeat against South Africa, but Sri Lanka did little to challenge them: their top-order batting was poor and the fast bowlers were toothless, which left Rangana Herath with far too much to do to salvage the situation. The overall numbers for the series indicate how vast the gulf was between the two sides: Australia averaged more than 46 runs per wicket, scored three centuries and 13 fifties, and took a wicket every 49 deliveries; Sri Lanka averaged less than 25 per wicket with the bat, scored one century and eight fifties, and took a wicket every 77 deliveries.
The list of batting and bowling averages for the two sides further illustrate the differences between the two teams. Five of Australia's batsmen averaged more than 50, and another one - Phil Hughes - averaged 46.60. Among their bowlers, three of them - Jackson Bird, Peter Siddle and Mitchell Johnson - averaged less than 20. For Sri Lanka, Kumar Sangakkara was the only one who played more than one Test and averaged more than 35 with the bat (though Dinesh Chandimal and Lahiru Thirimanne showed plenty of promise in the one Test they played). Tillakaratne Dilshan scored the only century of the series for them - his 147 in Hobart is the third-highest score by a Sri Lankan batsman in Tests in Australia - but then spoilt his series by adding only 61 in his next five innings, to end up with a series average of 34.67. Mahela Jayawardene scored fifties in each innings in Sydney, despite which his series average was 27.67; in 29 Tests that he's played in Australia, England, New Zealand and South Africa, Jayawardene averages 30.80, compared to his career average of 49.56. Thilan Samaraweera had had two fine series in England (average 50.50) and in South Africa (average 67.80), but had a forgettable six innings in Australia, averaging 13.16. Since that tour to South Africa in 2011-12, he has averaged 24.44 in 18 Test innings. Both Samaraweera and Jayawardene started this Test series with career averages of more than 50, which have fallen below that mark after the series.
| Team | W/ L | Runs per wkt | 100s/ 50s | Bowl SR |
| Australia | 3/ 0 | 46.34 | 3/ 13 | 49.03 |
| Sri Lanka | 0/ 3 | 24.94 | 1/ 8 | 77.26 |
Australia's pace attack of Siddle, Johnson, Bird and Mitchell Starc kept Sri Lanka's batsmen off-balance throughout the series - they managed to top 300 only once, and were twice bowled out for under 200. Overall, Australia's fast bowlers were superb, conceding less than 22 runs per wicket, and striking once every 7.3 overs.
For Sri Lanka's fast bowlers, this was yet another series where they failed to utilise helpful overseas conditions. They conceded nearly 60 runs per wicket, and leaked almost four per over, which meant Herath had to do both, the wicket-taking and the restricting job. He bowled more than twice the number of overs that any other Sri Lankan bowler did, and performed both roles splendidly, with 12 wickets at 33.91 and an economy rate of 3.02. No Sri Lankan bowler has taken more wickets in a series in Australia.
| Wickets | Average | Econ rate | Strike rate | 5WI/ 10WM | |
| Australia pace | 48 | 21.75 | 2.89 | 45.1 | 2/ 0 |
| Sri Lanka pace | 19 | 59.47 | 3.80 | 93.6 | 0/ 0 |
| Australia spin | 7 | 46.28 | 3.09 | 89.7 | 0/ 0 |
| Sri Lanka spin | 15 | 39.46 | 3.07 | 77.0 | 1/ 0 |
The single-biggest consistent problem for Sri Lanka on these tours has been the performance of their fast bowlers. On each of their last five tours to Australia, England or South Africa, Sri Lanka's pace attack has conceded more than 50 runs per wicket. On each of those tours, the home team fast bowlers averaged less than 33 - Australia averaged 21.75 in this series, South Africa 22.63 in 2011-12, England 32.60 in 2011, Australia 25.09 in 2007-08, and England 28.56 in 2006. Given that fast bowlers generally do most of the bowling - and are expected to do most of the damage - in these conditions, Sri Lanka's lack of firepower in these series has severely undermined the team's ability to compete.
In these five series, Chanaka Welegedara is the only Sri Lankan seamer to take more than ten wickets - he has 22 at 36.68. The next-highest wicket-taker is Dilhara Fernando, whose ten wickets have each cost him 71.60 runs. (Click here for the full list of Sri Lankan seamers in these series.)
| Series | Tests | Wickets | Average | Strike rate | Econ rate | 5WI/ 10WM |
| In Australia, 2012-13 | 3 | 19 | 59.47 | 93.6 | 3.80 | 0/ 0 |
| In South Africa, 2011-12 | 3 | 20 | 51.50 | 79.1 | 3.90 | 1/ 0 |
| In England, 2011 | 3 | 21 | 57.19 | 85.3 | 4.01 | 0/ 0 |
| In Australia, 2007-08 | 2 | 6 | 137.00 | 204.0 | 4.02 | 0/ 0 |
| in England, 2006 | 3 | 10 | 74.90 | 133.0 | 3.37 | 0/ 0 |
The wicket-wise partnerships stats also indicate the gulf between the top-orders of the two sides. While Australia consistently had significant partnerships for the top six wickets, Sri Lanka struggled to put together meaningful stands. They had only two which went beyond 100 in the entire series: 161 for the fifth wicket between Dilshan and Mathews in Hobart, and 108 between Mahela Jayawardene Dimuth Karunaratne for the second wicket in Sydney. None of their other partnerships topped 70, and there were only four other half-century stands. (Click here for the full list of partnerships for Sri Lanka)
Australia, on the other hand, had five century stands, and nine half-century ones (Click here for the full list). Apart from the third wicket, there was a century stand for each of the top six wickets.
| Wickets | Aus-Runs | Ave stand | 100/ 50 p'ships | SL-Runs | Ave stand | 100/ 50 p'ships |
| 1st | 281 | 56.20 | 1/ 1 | 115 | 19.16 | 0/ 0 |
| 2nd | 284 | 56.80 | 1/ 1 | 198 | 33.00 | 1/ 0 |
| 3rd | 187 | 37.40 | 0/ 2 | 198 | 33.00 | 0/ 2 |
| 4th | 281 | 56.20 | 1/ 1 | 144 | 24.00 | 0/ 0 |
| 5th | 168 | 33.60 | 1/ 0 | 367 | 61.16 | 1/ 2 |
| 6th | 262 | 87.33 | 1/ 1 | 149 | 24.83 | 0/ 0 |
| 7th | 144 | 48.00 | 0/ 2 | 75 | 12.50 | 0/ 0 |
Head-to-head contests
Not only was Siddle the highest wicket-taker in the series, he also did well against most of the Sri Lankan top-order batsmen, dismissing Mahela Jayawardene three times at an average of less than 20, and Sangakkara and Samaraweera twice each at single-digit average. The one batsman who played him well was Dilshan, who faced 94 balls from him without being dismissed. Dilshan also did well against Starc, scoring 74 from 92 balls. Johnson, though, had his number, dismissing him three times in 45 deliveries.
Most of the Australian batsmen had excellent stats against the Sri Lankan bowlers. Warner scored plenty against Welegedara and Shaminda Eranga, but Nuwan Kulasekara managed to keep him down to 20 from 11.1 overs. Herath, Sri Lanka's leading bowler, struggled to dismiss Clarke and Hussey, but overall he had pretty good numbers against both right and left-hand batsmen.
| Batsman | Bowler | Runs | Balls | Dismissals | Average |
| Tillakaratne Dilshan | Mitchell Johnson | 20 | 45 | 3 | 6.67 |
| Mahela Jayawardene | Peter Siddle | 59 | 119 | 3 | 19.67 |
| Dimuth Karunaratne | Jackson Bird | 15 | 51 | 3 | 3.00 |
| Thilan Samaraweera | Peter Siddle | 7 | 42 | 2 | 3.50 |
| Tillakaratne Dilshan | Mitchell Starc | 74 | 92 | 1 | 74.00 |
| Kumar Sangakkara | Peter Siddle | 18 | 59 | 2 | 9.00 |
| Tillakaratne Dilshan | Peter Siddle | 38 | 94 | 0 | - |
| David Warner | Chanaka Welegedara | 61 | 76 | 0 | - |
| David Warner | Chaminda Eranga | 56 | 55 | 0 | - |
| David Warner | Nuwan Kulasekara | 20 | 67 | 0 | - |
| Ed Cowan | Chanaka Welegedara | 39 | 69 | 2 | 19.50 |
| Michael Clarke | Rangana Herath | 95 | 173 | 1 | 95.00 |
| Michael Hussey | Rangana Herath | 64 | 114 | 0 | - |
| Right-hand batsmen | Rangana Herath | 154 | 318 | 5 | 30.80 |
| Left-hand batsmen | Rangana Herath | 254 | 490 | 7 | 36.28 |
S Rajesh is stats editor of ESPNcricinfo. Follow him on Twitter