Balanced bowling wins it for India
A statistical review of the India-Australia series
Mathew Varghese
11-Nov-2008
| ||
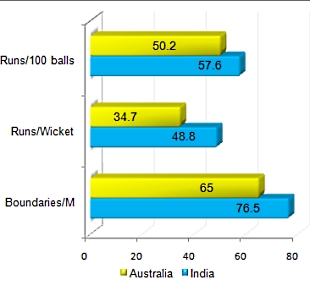
The "weakest Australian team to tour India" in recent years couldn't prove the critics wrong for once. After holding the upper hand in the first Test, Australia were playing catch-up in the other games, when India won the toss. Australia's bowlers, apart from Jason Krejza in the final Test, proved largely ineffective, going at nearly 50 runs per wicket, the worst in an away series since their tour of India in 1986-87. That time they drew 0-0 - including the tied Test in Madras - but that was because their batsmen averaged over 50.
On this tour, Australia's batsmen averaged 32.13. In fact, it's an improvement from their previous visits to India since 1986-87, including the successful 2004-05 tour, but the better pitches on offer could also be the reason. What hurt them was that India's line-up managed 45.91.
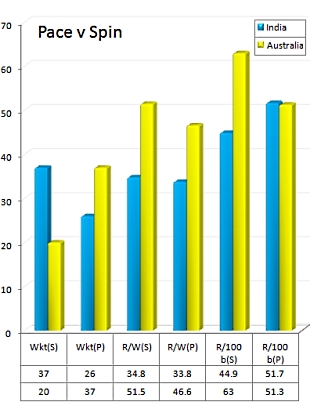
Australia may have struggled to get their spin-bowling options right; when they did, Krejza took 12 wickets, the best performance by an overseas spinner in India. Not many would have expected much of Cameron White - even Anil Kumble went nearly at 100 per wicket in the series - but Amit Mishra and Harbhajan Singh were potent enough to ensure India's spinners outdid their inexperienced counterparts.
It was on their fast bowling, though, that Australia had relied on in 2004-05 - they took 43 wickets at 21.72 then and India's fast bowlers managed 13 at 54.73. Spin was what fetched India 60 scalps; in contrast Australia's spinners had 25. On this visit, Australia expected a repeat, or a similar effort, from bowlers who hadn't played a Test in the country. However, their performance was far from satisfactory; Shane Watson was the only bowler to average below 40, and spearhead Brett Lee took just eight wickets in 148 overs, costing more then 60 per wicket. Lee, whose career-best average of 14.15 came in his debut series at home against India in 1999-00 and took 24 wickets in the home series last season, has struggled in his two other contests against India - in 2003-04 at home, he conceded nearly 60 per wicket. He's not done too well on the subcontinent either - on the tour of Bangladesh in 2005-06, he averaged 93, a big shortcoming for a bowler considered to be among the best in the world. (Click here for the bowling averages for this tour, and here for the averages in 2004-05.)
While Australia struggled with both pace and spin, India's fast bowlers showed how a balanced strike force makes for a match-winning bowling attack.
| ||
Ishant Sharma's 15 wickets earned him the Man of the Series award, the first for an Indian fast bowler at home since Kapil Dev in 1983. And, going by his early progress, India look to have found a match-winning fast bowler on home conditions. (Among Indian fast bowlers with 25 wickets in India, Ishant averages the best.)
India's middle order, which had collectively performed poorly during the tour of Sri Lanka, ticked as a unit against Australia. VVS Laxman averaged nearly 100, but Gautam Gambhir was the unlikely star, scoring 463 runs with back-to-back hundreds in Mohali and Delhi. Mahendra Singh Dhoni, Sachin Tendulkar and Sourav Ganguly, playing his farewell series, all averaged over 50, and Virender Sehwag in the 40s. Dhoni's tally of 307 was the best for an Indian wicketkeeper in a Test series in over 35 years: Farokh Engineer scored 415 in the five-Test series against England in 1972.
Rahul Dravid was the only one to miss out; his series average of 17.14 was the worst for India since the three-Test series in Australia in 1999-2000. India's tail also contributed: Zaheer Khan top-scored with 57 not out in India's first innings of the series, and Harbhajan hit two fifties; since the start of 2008, only two batsmen batting at No. 8 or lower have hit four 50-plus scores: Daniel Vettori and Harbhajan.
For Australia, only Michael Hussey and Simon Katich averaged near 50. The trio of Matthew Hayden, Michael Clarke and Ricky Ponting, with past Test experience in Indian conditions, failed to step it up, all falling below the 40-run mark in the averages. During his 77 in Australia's final innings, Hayden became just the third overseas batsman to score 1000 runs in India, after Clive Lloyd and Gordon Greenidge. Half of Hayden's 1027, though, came on the 2001 tour: on the 2004-05 trip, he managed only ten runs more than his 234 this time around. Ponting exorcised his Indian ghosts by scoring a century in Australia's first innings in Bangalore but, in his five innings since that 123, he scored a further 143. (Click here for the batting averages in the series.)
India's openers gave their team brisk and steady starts but perhaps they missed a trick by not promoting VVS Laxman to No. 3. Dravid's struggle is a reason why the averages for the second and third partnership dip, but the rest of India's middle order ensured they put on useful stands consistently.
| Wicket | India's average | Run-rate | 100s/ 50s | Australia's average | Run-rate | 100s/ 50s |
|---|---|---|---|---|---|---|
| First | 73.25 | 4.35 | 2/3 | 40.71 | 3.78 | 1/0 |
| Second | 22.00 | 3.09 | 0/1 | 48.71 | 3.18 | 1/1 |
| Third | 39.12 | 3.22 | 1/2 | 62.71 | 2.86 | 1/3 |
| Fourth | 85.57 | 3.26 | 2/1 | 31.42 | 2.88 | 0/1 |
| Fifth | 55.33 | 2.98 | 1/1 | 19.85 | 3.06 | 0/1 |
| Sixth | 56.60 | 3.21 | 1/1 | 43.00 | 2.95 | 0/3 |
| Seventh | 70.60 | 3.89 | 2/1 | 39.16 | 3.05 | 1/1 |
| Eighth | 36.75 | 3.76 | 0/1 | 30.33 | 2.35 | 0/2 |
| Ninth | 15.00 | 3.27 | 0/0 | 18.66 | 3.15 | 0/1 |
| Tenth | 7.00 | 2.21 | 0/0 | 6.50 | 3.00 | 0/0 |
Head-to-head contests
Lee had a poor series, but he did manage to dismiss Sehwag and Dravid three time each in the series. The only other batsman to fall to him were Gautam Gambhir and Sourav Ganguly, while the rest picked up runs without losing their wicket even once.
Lee had a poor series, but he did manage to dismiss Sehwag and Dravid three time each in the series. The only other batsman to fall to him were Gautam Gambhir and Sourav Ganguly, while the rest picked up runs without losing their wicket even once.
| Versus | Runs | Balls | Dismissals | Average | |||||||||||||||||||||||||||||||||||
|---|---|---|---|---|---|---|---|---|---|---|---|---|---|---|---|---|---|---|---|---|---|---|---|---|---|---|---|---|---|---|---|---|---|---|---|---|---|---|---|
| Rahul Dravid | 30 | 76 | 3 | 10.00 | |||||||||||||||||||||||||||||||||||
| Virender Sehwag | 44 | 67 | 3 | 14.66 | |||||||||||||||||||||||||||||||||||
| The rest | 400 | 758 | 2 | 200.00 |
| Contest | Runs | Balls | Dismissals | Average |
|---|---|---|---|---|
| Zaheer v Hayden | 73 | 118 | 3 | 24.33 |
| Mishra v Clarke | 52 | 121 | 3 | 17.33 |
| Ishant v right-handers | 217 | 420 | 12 | 18.08 |
| Ishant v left-handers | 170 | 416 | 3 | 56.66 |
| Harbhajan v left-handers | 238 | 485 | 7 | 34.00 |
| Harbhajan v right-handers | 192 | 551 | 8 | 24.00 |
Mathew Varghese is sub-editor (stats) at Cricinfo