New England setting the pace early
All sorts of batting records have been broken in the England-New Zealand ODI series, and the hosts' bold approach - especially in the first 30 - has been the main reason for this
S Rajesh
19-Jun-2015
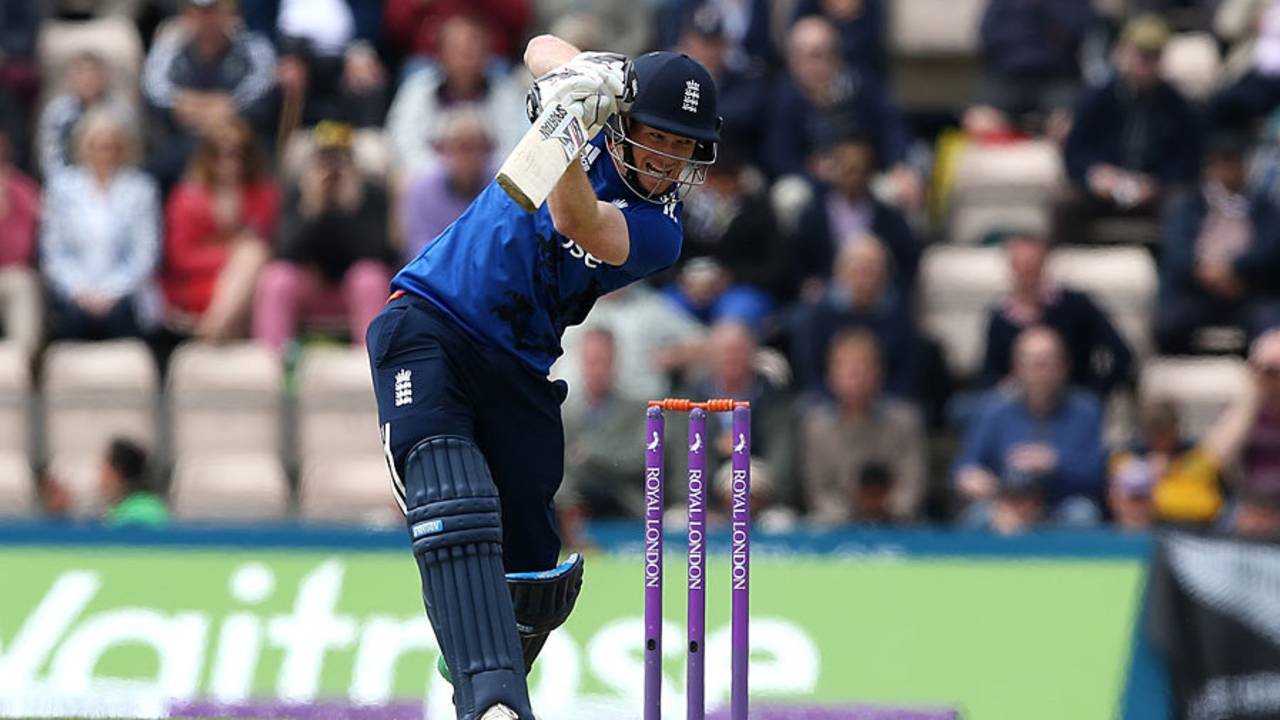
Eoin Morgan's dynamic batting has a been a big factor in England scoring at a rate of 7.09 runs per over in the first 30 overs in the series against New Zealand • Getty Images
The first four matches of the ODI series between England and New Zealand have probably delighted the statisticians as much as they have England's fans. A team which has almost always played a conservative brand of cricket has suddenly unveiled a brand new, fearless approach, against an opponent known to play aggressively, and the result has been a relentless concoction of runs and boundaries. The bowlers wouldn't be thrilled at the numbers, but for the batsmen from both teams it's been a fun ride. Here are just some of the records from this series:
- In four matches so far, 2676 runs have been scored, at an average of 7.32 runs per over. That's the first time a series of more than one match has had a run rate of more than seven.
A comparison between the England of the 2015 World Cup and the England of this series highlights the difference between the two teams: in four matches against one of the top ten teams in the World Cup - Australia, New Zealand, Sri Lanka and Bangladesh - England averaged only 25.63 runs per wicket, and 5.31 per over. Not surprisingly, they lost all four of those games. In this series, England's run-rate has shot up by 45%, and is by far their best in a series of at least four games: their next-best is only 6.19.
| Series | Matches | W/ L | Average | Run rate | 300+ totals | 100s/ 50s |
| England in the 2015 World Cup* | 4 | 0-4 | 25.63 | 5.31 | 1 | 1/ 3 |
| England, v NZ, 2015 home series | 4 | 2-2 | 45.96 | 7.68 | 4 | 4/ 8 |
In the England-New Zealand series so far, there have been 269 fours and 69 sixes from 2198 deliveries, which works out to an average of a four or a six every 6.5 balls. That means, on average, there has been a four or a six practically every over in this series. The frequency of boundaries is again the best in any series of four or more games; the previous-best was 7.2, in the India-Australia series of 2013.
| Series | Mat | Ave | Run rate | 300+ totals | Balls per 4/6 |
| NZ in Eng 2015 | 4 | 44.60 | 7.32 | 7 | 6.50 |
| Aust in Ind 2013-14 | 6 | 49.26 | 6.64 | 9 | 7.20 |
| Ind in NZ 2008-09 | 5 | 44.16 | 6.62 | 2 | 7.79 |
| SL in Ind 2009-10 | 5 | 46.87 | 6.43 | 6 | 8.12 |
| WI in SA 2014-15 | 5 | 36.25 | 6.14 | 2 | 8.54 |
| Ind in Pak 2003-04 | 5 | 38.48 | 6.06 | 4 | 9.58 |
| WI in NZ 2013-14 | 4 | 31.96 | 6.03 | 1 | 8.35 |
| SL in Ind 2014-15 | 5 | 39.74 | 6.02 | 2 | 8.36 |
| SL in Eng 2006 | 5 | 40.28 | 6.01 | 4 | 9.82 |
| Eng in Ind 2008-09 | 5 | 35.81 | 6.01 | 1 | 8.26 |
The series run rate in the last ten overs is 9.57, and while that's pretty impressive, what's even better is the rate at which both teams have gone in the first 30. England have been particularly busy during this period, as if compensating for all the years when they played ultra-conservatively through the early part of their innings. The mantra earlier used to be singles through the early part of the innings and keeping wickets in hand, but now, with a top order of Alex Hales, Jason Roy, Joe Root, Eoin Morgan, Ben Stokes and Jos Buttler, England have a line-up in which each batsman can press the accelerator, and do it without moving out of his comfort zone.
In this series, England have motored along at 7.09 runs per over in the first 30 overs, which is easily their best in a series - their previous highest in the first 30 was 6.05, in the home series against India in 2011. That's an improvement of about 17%. In the 2015 World Cup, their run rate in the first 30 overs against the four top-ten teams they played was 4.54. New Zealand, in the first 30 in this series, have averaged 6.50 runs per over.
Five of England's top six batsmen have scored at a run a ball or more in the first 30 overs in this series so far. Morgan has scored the most runs in this period (242 off 199 balls), followed by Root (227 off 208), while Hales (164 of 128), Roy (86 off 90), Stokes (58 off 45) and Buttler (44 off 44) have all been extremely impressive as well.
| Series | Inngs | Run rate | Ave |
| NZ in Eng 2015 | 8 | 6.79 | 56.24 |
| SL in Ind 2009-10 | 9 | 6.18 | 70.86 |
| Ind in NZ 2008-09 | 9 | 6.16 | 45.97 |
| SL in Eng 2006 | 10 | 5.85 | 70.24 |
| Aus in Ind 2013-14 | 12 | 5.70 | 56.08 |
| WI in NZ 2013-14 | 8 | 5.67 | 28.95 |
| Eng in Ind 2008-09 | 10 | 5.59 | 37.85 |
| Ind in Pak 2003-04 | 10 | 5.54 | 46.22 |
New Zealand have played their part too in making this a nightmare series for bowlers, but their aggression has been a given in recent times. The focus has been on England simply because their style of batting and run-gathering has changed so drastically from the 2015 World Cup.
All the runs scored in this series, and in the World Cup, means that the ODI run rate in 2015 is easily the highest among all calendar years. From 5.29 in 2014, it has zoomed ahead to 5.67 in 2015, an increase of 7%. For the bowlers who have struggled over the past six months, the rule changes, which have already been proposed by ICC's cricket committee, can't come soon enough.
| Year | Mat | Ave | Run rate |
| 2015 | 87 | 33.80 | 5.67 |
| 2014 | 121 | 31.53 | 5.29 |
| 2009 | 150 | 30.92 | 5.12 |
| 2013 | 136 | 30.65 | 5.11 |
| 2005 | 107 | 31.38 | 5.10 |
| 2012 | 90 | 31.09 | 5.05 |
| 2011 | 146 | 29.97 | 5.04 |
| 2007 | 191 | 30.39 | 5.04 |
S Rajesh is stats editor of ESPNcricinfo. Follow him on Twitter