England fail first trial by spin
Facing up to quality spinners in foreign conditions, the England batsmen were found severely wanting in both their technique and application
Madhusudhan Ramakrishnan
07-Feb-2012
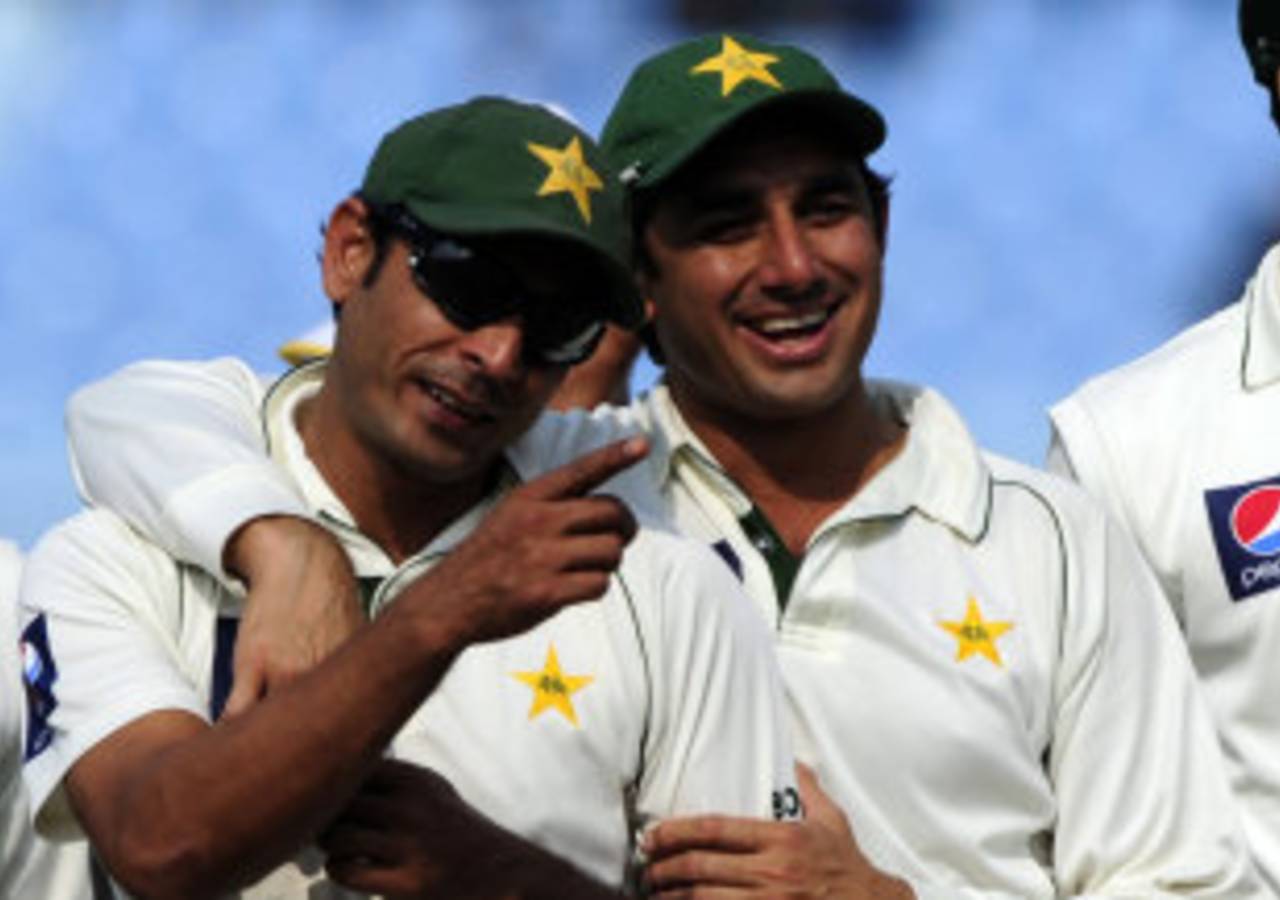
Saeed Ajmal and Abdur Rehman shared 43 wickets between them in a series dominated by spinners • AFP
For the second time in recent months, the top-ranked Test team was trounced in an away series. Six months back, it was India who were whitewashed 4-0 by England, who subsequently assumed the mantle of world No 1. Now, in their first series against Pakistan at a neutral venue, England have been stunned 3-0 on pitches that provided a fair deal of assistance to spin. The England batsmen had virtually no clue against the variations of Saeed Ajmal and Abdur Rehman, who went on to share 43 of the 60 wickets. Throughout the series, England's bowlers kept their team in the hunt, but the batting, which had been a cornerstone of their recent success, completely came apart. Given the fact that no team had scored more centuries in the last two years, it was almost shocking that not a single England batsman managed a hundred in the three-Test series. It was the first time since 1999 and only the eighth time overall that England have gone through a full series (three or more matches) without a single century. Pakistan's remarkable win was also their first ever series whitewash of England and only the second suffered by England against teams other than Australia and West Indies.
Low-point for England's batting
After being dominated in the first Test, England's fine bowling displays gave them control initially in both the second and third Tests but poor batting performances meant they could not consolidate their position in either. England, who were bowled out for under 200 four times, had a similar batting failure only once in the last five years (in Australia 2006-07) when they were dismissed for sub-200 scores five times in a 5-0 whitewash. England's batting average in the series (19.06) was their lowest since 1888 and their lowest in a series where they have lost all Tests. However, their bowling performance in the series ensured that the average difference (-6.70) (difference between batting and bowling averages) and wickets difference (10) for England is not terrible. However, considering the bowling quality they were up against while facing powerful Australian and West Indies teams in the past, England's batting performance in this series is shown up in very poor light.
After being dominated in the first Test, England's fine bowling displays gave them control initially in both the second and third Tests but poor batting performances meant they could not consolidate their position in either. England, who were bowled out for under 200 four times, had a similar batting failure only once in the last five years (in Australia 2006-07) when they were dismissed for sub-200 scores five times in a 5-0 whitewash. England's batting average in the series (19.06) was their lowest since 1888 and their lowest in a series where they have lost all Tests. However, their bowling performance in the series ensured that the average difference (-6.70) (difference between batting and bowling averages) and wickets difference (10) for England is not terrible. However, considering the bowling quality they were up against while facing powerful Australian and West Indies teams in the past, England's batting performance in this series is shown up in very poor light.
| Opposition | Year | Result | Batting average | Bowling average | Average diff | 100s (England/opposition) | Wickets (England/opposition) |
| Australia | 1920-21 | 5-0 | 28.35 | 46.13 | -17.78 | 4/10 | 73/98 |
| Australia | 1979-80 | 3-0 | 23.03 | 33.15 | -10.12 | 1/2 | 46/60 |
| West Indies | 1984 | 5-0 | 23.34 | 42.28 | -18.94 | 4/7 | 63/96 |
| West Indies | 1985-86 | 5-0 | 20.20 | 41.72 | -21.52 | 0/4 | 55/100 |
| India | 1992-93 | 3-0 | 26.05 | 57.28 | -31.23 | 2/4 | 28/60 |
| Australia | 2006-07 | 5-0 | 26.35 | 52.77 | -26.42 | 3/9 | 59/96 |
| Pakistan | 2011-12 | 3-0 | 19.06 | 25.76 | -6.70 | 0/2 | 50/60 |
Tourists' batsmen fail to stand up
From the high of the triumphs in the Ashes and the India series, England's batting order hit rock bottom against Pakistan. Not only did they fail to register a hundred, they also averaged just 19.06. Their top-order (1-3), including the successful opening pair of Andrew Strauss and Alastair Cook, struggled and averaged just 26.22. Pakistan's top three fared much better (average 35.20) but were far from consistent. The Pakistan batsmen completely dominated the middle-order (4-7) numbers, scoring nearly twice the runs and averaging 31.45 to England's 15.81. On more than one occasion, England's lower order batsmen (8-11) came to the rescue after the top order had failed. They scored 273 runs at 13.65 and performed much better than the corresponding Pakistan batsmen, who failed to put up a fight, with only 85 runs at an average of 5.66. Overall, the top seven batsmen for England averaged just 20.50, their third-lowest average in a series of three or more matches and their lowest for nearly 76 years.
From the high of the triumphs in the Ashes and the India series, England's batting order hit rock bottom against Pakistan. Not only did they fail to register a hundred, they also averaged just 19.06. Their top-order (1-3), including the successful opening pair of Andrew Strauss and Alastair Cook, struggled and averaged just 26.22. Pakistan's top three fared much better (average 35.20) but were far from consistent. The Pakistan batsmen completely dominated the middle-order (4-7) numbers, scoring nearly twice the runs and averaging 31.45 to England's 15.81. On more than one occasion, England's lower order batsmen (8-11) came to the rescue after the top order had failed. They scored 273 runs at 13.65 and performed much better than the corresponding Pakistan batsmen, who failed to put up a fight, with only 85 runs at an average of 5.66. Overall, the top seven batsmen for England averaged just 20.50, their third-lowest average in a series of three or more matches and their lowest for nearly 76 years.
| Team | Top-order (1-3)- runs/avg | Top-order (1-3)- 100/50 |
Middle-order (4-7)- runs/avg |
Middle-order (4-7)- 100/50 |
Lower-order (8-11)- runs/avg |
Lower-order (8-11)- 100/50 |
| Pakistan | 528/35.20 | 1/3 | 629/31.45 | 1/4 | 85/5.66 | 0/0 |
| England | 472/26.22 | 0/3 | 348/15.81 | 0/1 | 273/13.65 | 0/1 |
England's poor batting form is quite clearly reflected in the partnership stats. Cook and Strauss fought hard but were seldom able to convert on starts. Pakistan's openers, on the other hand, did a much better job and were also involved in a century partnership in the first Test. However, Pakistan's second-wicket average (8.60) was their fourth-lowest in a series (min five partnerships). England enjoyed a better performance for the second wicket but had no other significant contribution from the middle-order stands. Ian Bell's woeful form meant that the fourth-wicket partnership for England (5.50) is their lowest ever in a series (min five stands). Overall, the series witnessed four century stands of which Pakistan contributed three.
| Partnership wicket | England (Runs/avg) | England (100/50 stands) | Pakistan (Runs/avg) | Pakistan (100/50 stands) |
| 1 | 117/19.50 | 0/0 | 226/45.20 | 1/1 |
| 2 | 223/37.16 | 1/0 | 43/8.60 | 0/0 |
| 3 | 138/23.00 | 0/1 | 318/63.60 | 1/0 |
| 4 | 33/5.50 | 0/0 | 139/27.80 | 0/1 |
| 5 | 113/18.83 | 0/0 | 225/45.00 | 1/1 |
| 6 | 97/16.16 | 0/0 | 117/23.40 | 0/1 |
| 7 | 98/16.33 | 0/0 | 40/8.00 | 0/0 |
Spinners call the shots
The Pakistan spinners picked up 48 wickets in the series at an exceptional average of 15.64. This was the best performance for Pakistan spinners both in terms of wickets and average in a three-Test series. Ajmal, who became the fastest Pakistan bowler to reach the landmark of 100 wickets (19 Tests) during the series, was the top wicket-taker with 24 wickets at 14.70. His tally is the fifth-highest by a Pakistan bowler in a three-match series. He was ably complemented by Rehman, who finished with 19 wickets at 16.73. The England spinners were not too bad themselves, with Monty Panesar and Graeme Swann picking up 27 wickets between them. Panesar, in particular, justified his inclusion, by finishing with 14 wickets at an excellent average of 21.57. However, Stuart Broad was England's best bowler in the series, ending with 13 wickets at 20.46. In the end though, it was a series in which spin trumped pace on all counts.
The Pakistan spinners picked up 48 wickets in the series at an exceptional average of 15.64. This was the best performance for Pakistan spinners both in terms of wickets and average in a three-Test series. Ajmal, who became the fastest Pakistan bowler to reach the landmark of 100 wickets (19 Tests) during the series, was the top wicket-taker with 24 wickets at 14.70. His tally is the fifth-highest by a Pakistan bowler in a three-match series. He was ably complemented by Rehman, who finished with 19 wickets at 16.73. The England spinners were not too bad themselves, with Monty Panesar and Graeme Swann picking up 27 wickets between them. Panesar, in particular, justified his inclusion, by finishing with 14 wickets at an excellent average of 21.57. However, Stuart Broad was England's best bowler in the series, ending with 13 wickets at 20.46. In the end though, it was a series in which spin trumped pace on all counts.
| Bowler type | Team | Wickets | Average/SR | 5WI/10WM |
| Pace | England | 23 | 26.52/67.1 | 0/0 |
| Spin | England | 27 | 23.59/57.5 | 2/0 |
| Pace | Pakistan | 12 | 29.00/54.6 | 0/0 |
| Spin | Pakistan | 48 | 15.64/40.2 | 3/1 |
Overall, 75 wickets were picked up by spinners. This heavily spin-dominated series is now third on the list of series in which most wickets have fallen to spin (three-Test series). In both the series where the spinners' wicket aggregate has been higher, (Sri Lanka-New Zealand 1998 and Sri Lanka-Australia 2004), the home team spinners finished with more wickets than their visiting counterparts. However in 2004, the Australian spinners led by Shane Warne finished with a much better average (24.27) than the Sri Lankan spinners (34.64) to set up a remarkable 3-0 away win. In the Pakistan-England series, pace bowlers also finished with competitive figures which meant that the average difference between pace and spin (8.87) was not too high. The percentage contribution of wickets for spinners (68.18%) in the series is only higher than the corresponding figure in the Sri Lanka-Australia series, where spinners picked up 64.40% of the wickets.
| Series | Result | Spin (wickets/avg) | Pace (wickets/avg) | Avg diff | % wickets (spin/pace) | Spin wickets (host/visitors) |
| Sri Lanka-New Zealand 1998 | 2-1 (SL) | 79/24.15 | 20/37.10 | 12.95 | 74.52/18.86 | 50/29 |
| Sri Lanka-Australia 2004 | 3-0 (Aus) | 76/29.59 | 39/33.20 | 3.61 | 64.40/33.05 | 39/37 |
| Pakistan-England (UAE) 2012 | 3-0 (Pak) | 75/18.50 | 35/27.37 | 8.87 | 68.18/31.81 | 48/27 |
| Pakistan-New Zealand 1969-70 | 1-0 (NZ) | 71/22.49 | 26/22.69 | 0.20 | 71.71/26.26 | 43/28 |
| Sri Lanka-India 2008 | 2-1 (SL) | 71/25.71 | 25/44.16 | 18.45 | 73.95/26.04 | 47/24 |
Pakistan's spin duo too hot to handle
England came into the series with very little experience of playing high-quality spin in recent years. They were left to rue that fact, as they were all at sea against Ajmal and Rehman. Bell, who scored five centuries in eight Tests in 2011, struggled with his footwork and was tormented by Ajmal's variety, eventually falling to the offspinner four times in 50 balls faced. Kevin Pietersen, who had in the past, done well against top-class spinners like Warne and Muttiah Muralitharan, was never in control and fell to Ajmal three times, scoring just 15 runs in 43 balls. Rehman also troubled the left-handers with deliveries turning in and dismissed Strauss and Eoin Morgan three times each. Cook, England's highest run-getter in the series, never quite got on top of Ajmal, but was able to occupy the crease much longer than his team-mates.
England came into the series with very little experience of playing high-quality spin in recent years. They were left to rue that fact, as they were all at sea against Ajmal and Rehman. Bell, who scored five centuries in eight Tests in 2011, struggled with his footwork and was tormented by Ajmal's variety, eventually falling to the offspinner four times in 50 balls faced. Kevin Pietersen, who had in the past, done well against top-class spinners like Warne and Muttiah Muralitharan, was never in control and fell to Ajmal three times, scoring just 15 runs in 43 balls. Rehman also troubled the left-handers with deliveries turning in and dismissed Strauss and Eoin Morgan three times each. Cook, England's highest run-getter in the series, never quite got on top of Ajmal, but was able to occupy the crease much longer than his team-mates.
| Batsman | Bowler | Dismissals | Average | Balls/dismissal |
| Ian Bell | Saeed Ajmal | 4 | 4.25 | 12.50 |
| Kevin Pietersen | Saeed Ajmal | 3 | 5.00 | 14.33 |
| Eoin Morgan | Abdur Rehman | 3 | 7.33 | 19.66 |
| Andrew Strauss | Abdur Rehman | 3 | 12.66 | 31.00 |
| Alastair Cook | Saeed Ajmal | 2 | 27.50 | 87.50 |
| Kevin Pietersen | Abdur Rehman | 2 | 15.50 | 48.00 |
On tracks that had little for pace bowlers, Broad exhibited outstanding control and discipline. Pakistan's centurions in the series, Younis Khan and Azhar Ali, fell three times each to Broad, averaging 15.33 and 13.33 respectively against him. Panesar had the better of Mohammad Hafeez, picking up the opener's wicket three times in 54 balls. Swann continued his good form against left-handers, dismissing Taufeeq Umar twice and conceding just 16 runs.
| Batsman | Bowler | Dismissals | Average | Balls/dismissal |
| Mohammad Hafeez | Monty Panesar | 3 | 11.33 | 18.00 |
| Younis Khan | Stuart Broad | 3 | 15.33 | 30.66 |
| Asad Shafiq | Monty Panesar | 3 | 17.00 | 53.33 |
| Azhar Ali | Stuart Broad | 3 | 13.33 | 52.66 |
| Misbah-ul-Haq | Monty Panesar | 2 | 23.00 | 60.00 |
| Taufeeq Umar | Graeme Swann | 2 | 8.00 | 19.00 |
Before the series, there were fears of placid tracks and dull draws. However, the series average of 22.10 was the lowest in the three series played in the UAE. Although the pitches kept both the batsmen and bowlers interested, it was the use of the DRS that provided the edge to the spinners. Quite a few reviews were struck down but there were seven not out lbw decisions that were overturned, including four in the final Test. The number of leg-before dismissals (43) was by far a record for a three-match series and proved crucial to the outcome of the contest.