Malinga factor boosts Sri Lanka
South Africa and Sri Lanka have been evenly matched in ODIs over the years but home advantage will give the hosts a slight edge going into the series
Madhusudhan Ramakrishnan
10-Jan-2012
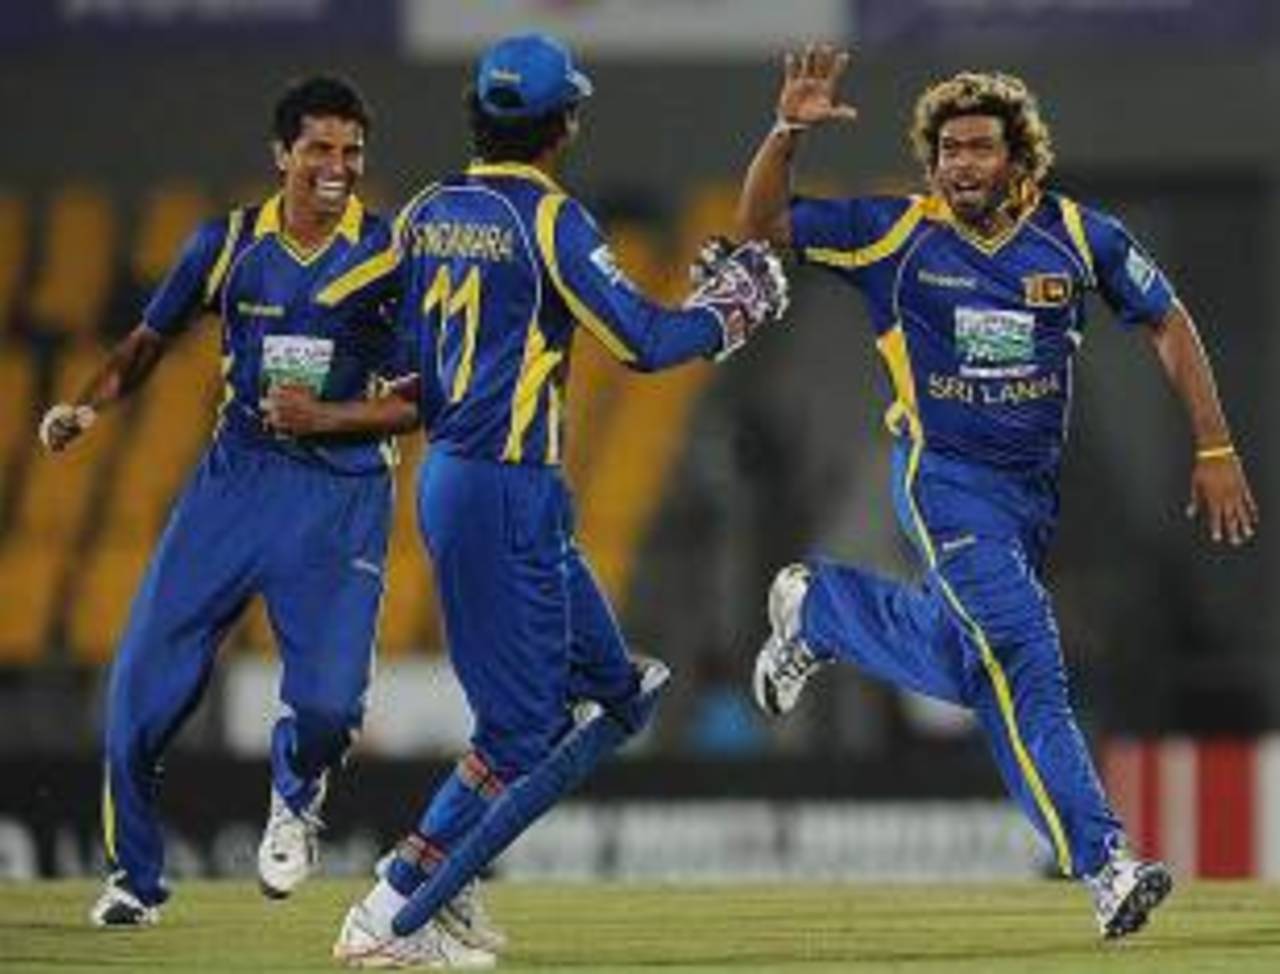
Lasith Malinga has been Sri Lanka's highest wicket-taker in ODIs since 2009 with 77 wickets at 24.71 • AFP
At the end of a series in which they won a Test in South Africa for the first time but were dominated in the other two matches, Sri Lanka will be confident of a better display in the ODIs. They have a strong recent record in the format and have matched South Africa in head-to-head contests. South Africa will be looking to continue their proud home record in ODIs, which has seen them lose only two of their last 17 bilateral home series. In their two previous home series, South Africa managed a close 3-2 win against India but went down 1-2 to Australia. Sri Lanka, the runners-up in last year's World Cup, have had a patchy run in recent ODIs with defeats against England, Australia and Pakistan in their three previous series.
South Africa and Sri Lanka have played each other very few times in the last few years. Since 2005, they have met just seven times while India and Sri Lanka have played each other in 50 matches in the same period. The teams have dominated each other in their respective home Tests and the story is the same in ODIs too. South Africa have by far been the better side in home ODIs, in conditions favouring pace and bounce. They have won 12 and lost just five matches to Sri Lanka at home but surprisingly lost their previous encounter by 55 runs in Centurion during the Champions Trophy in 2009.
In Sri Lanka, on pitches that tend to keep low and favour the spinners, South Africa have managed just one win while losing nine games. Overall, both teams are locked on 22 wins each, with the average difference (0.92) and run-rate difference (0.07) marginally in favour of South Africa. South Africa's dominance at home and struggles away are reflected in the average and run-rate differences (9.40/0.56 in South Africa and -10.01/-0.50 in Sri Lanka). South Africa are slightly ahead on the head-to-head in neutral venues, winning nine out of 17 matches. Sri Lanka, despite having a poor record in South Africa, will be aware that they managed to upset the hosts in two of the biggest matches between the teams - in the World Cup game in 2003 and in the Champions Trophy in 2009.
| Played | Wins | Losses | W/L ratio | Bat avg/Bowl avg | Avg diff | Run rate/Economy rate | RR diff | |
| Overall | 46 | 22 | 22 | 1.00 | 28.07/27.15 | 0.92 | 4.72/4.65 | 0.07 |
| Home | 18 | 12 | 5 | 2.40 | 35.61/26.21 | 9.40 | 5.12/4.56 | 0.56 |
| Away | 11 | 1 | 9 | 0.11 | 22.86/32.87 | -10.01 | 4.34/4.84 | -0.50 |
| Neutral | 17 | 9 | 8 | 1.12 | 25.54/25.14 | 0.40 | 4.55/4.62 | -0.07 |
| 1990-1999 | 16 | 9 | 6 | 1.50 | 24.60/21.54 | 3.06 | 4.53/4.20 | 0.33 |
| 2000-2004 | 23 | 9 | 13 | 0.69 | 31.08/31.53 | -0.45 | 4.85/4.82 | 0.03 |
| Since 2005 | 7 | 4 | 3 | 1.33 | 27.14/27.59 | -0.45 | 4.67/5.00 | -0.33 |
South Africa have played far fewer ODIs since the start of 2009 than most top teams. However, they have a superb win-loss ratio of 1.88, which is behind only Australia's (2.03). Sri Lanka's win-loss ratio is fourth behind Australia's, South Africa's and India's but their run-rate difference of 0.37 is second only to India's 0.55. Australia and India lead the table with average differences of 8.78 and 8.42 followed by South Africa, who have a corresponding figure of 6.78. While Sri Lanka's wins have been equally distributed in matches batting first (21 wins) and chasing (20 wins), South Africa's wins are skewed towards matches when they have batted first. Of their 32 wins, 21 have come in games when they have batted first with just six defeats, while they have a 11-11 record in matches when they have fielded first.
| Team | Played | Wins/Losses | W-L ratio | W/L (bat first) | W/L (chases) | Bat avg/Bowl avg | Avg diff | RR/ER | RR diff |
| Australia | 89 | 57/28 | 2.03 | 31/19 | 26/9 | 36.52/27.74 | 8.78 | 5.29/4.98 | 0.31 |
| South Africa | 49 | 32/17 | 1.88 | 21/6 | 11/11 | 37.94/31.68 | 6.26 | 5.62/5.38 | 0.24 |
| India | 92 | 55/30 | 1.83 | 22/16 | 33/14 | 37.89/29.47 | 8.42 | 5.62/5.07 | 0.55 |
| Sri Lanka | 77 | 41/32 | 1.28 | 20/18 | 21/14 | 32.46/28.95 | 3.51 | 5.20/4.83 | 0.37 |
| Pakistan | 70 | 37/32 | 1.15 | 18/14 | 19/18 | 28.34/32.44 | -4.10 | 4.91/5.31 | -0.40 |
| England | 69 | 34/32 | 1.06 | 15/16 | 19/16 | 31.11/27.12 | 3.99 | 5.28/5.13 | 0.15 |
A prime reason for South Africa's success in the ODI format has been the form of their top-order batsmen. AB de Villiers, who was the leading run-getter in the Test series, has been outstanding in the shorter form too. He averages 62.65 and has a strike-rate close to 100 in matches played since the start of 2009. de Villiers has a lower boundary-run percentage as a consequence of coming in later in the innings (40.58) but also a very low dot-ball percentage (39.23) mainly because of his ability to rotate the strike. Hashim Amla, who had an ordinary Test series by his standards, will relish playing in a format in which he has averaged over 55 in the last two years. The South African middle order is boosted further by the presence of their highest run-scorer Jacques Kallis and one-day specialist JP Duminy. Perhaps the only concern for South Africa will be the waning form of Graeme Smith, who has averaged just 32.86 in the same period.
| Batsman | Matches | Runs | Average | SR | 100/50 | Boundary % | Dot-Ball % |
| AB de Villiers | 43 | 2193 | 62.65 | 99.23 | 8/12 | 40.58 | 39.23 |
| Hashim Amla | 42 | 2170 | 55.64 | 91.75 | 7/14 | 40.82 | 44.46 |
| Jacques Kallis | 34 | 1501 | 46.90 | 83.01 | 1/15 | 38.50 | 46.68 |
| JP Duminy | 44 | 1471 | 44.57 | 90.74 | 2/10 | 30.31 | 39.54 |
| Graeme Smith | 39 | 1249 | 32.86 | 80.68 | 1/7 | 46.11 | 54.65 |
The Sri Lanka batsmen, who had a testing time in the Test series, will look to get their act together in a format where they have been far more prolific. Kumar Sangakkara has been extremely consistent (average of 44.00 since January 2009) but has struggled to convert his half-centuries into centuries. Tillakaratne Dilshan, the top-scorer in the World Cup last year, is a definite threat at the top of the order despite coming into the series on the back of a horror run in the Tests. With nine centuries and ten fifties at a terrific strike-rate of 96.07 since 2009, he, together with Upul Tharanga, will be crucial to Sri Lanka's chances. Tharanga and Dilshan were involved in two double-century stands in the World Cup against Zimbabwe and England. Mahela Jayawardene, who scored a superb century in the World Cup final, has averaged in the mid-thirties but has regularly demonstrated an ability to control the innings. Almost all the Sri Lanka batsmen have higher boundary-run and dot-ball percentages than their South African counterparts, which suggests a contrasting approach to batting from both teams.
| Batsman | Matches | Runs | Average | SR | 100/50 | Boundary% | Dot-ball % |
| Kumar Sangakkara | 71 | 2772 | 44.00 | 78.28 | 1/24 | 40.62 | 52.72 |
| Tillakaratne Dilshan | 67 | 2741 | 44.20 | 96.07 | 9/10 | 55.89 | 51.84 |
| Mahela Jayawardene | 68 | 2210 | 36.83 | 82.09 | 5/14 | 39.36 | 49.25 |
| Upul Tharanga | 57 | 2056 | 41.12 | 76.60 | 6/11 | 50.09 | 58.34 |
| Angelo Mathews | 56 | 1140 | 34.54 | 80.39 | 0/8 | 36.14 | 49.92 |
During the Tests, Sri Lanka were plagued by the lack of a genuine matchwinning bowler. In the ODIs, however, they are boosted by the return of Lasith Malinga. Malinga, who has been remarkably accurate in the beginning and death overs, has been Sri Lanka's most successful bowler in the last two years. In the World Cup game against South Africa in 2007, Malinga singlehandedly brought Sri Lanka back into the contest with a stunning burst of four wickets in consecutive balls. Since 2009, he averages 24.71 with five hauls of four wickets or more and has an extremely low boundary-run percentage (42.03). Nuwan Kulasekara, despite being quite successful in the same period, has a far higher average (34.09) and boundary-run percentage (53.91) than Malinga.
Since his debut in 2005, Dale Steyn has played in just 57 ODIs and has been less of a force in the limited-overs format. Still, over the last two years, Steyn has a very good average (26.31) and a low boundary-run percentage (48.97) though his economy rate(4.61) is slightly on the higher side. Morne Morkel, who was not at his best in the Tests, will be a big threat for Sri Lanka given the conditions and his ODI form. Since 2009, Morkel averages 21.94 at an economy rate of 4.46 and also boasts a low boundary-run percentage (47.55).
| Bowler | Matches | Wickets | Average | Economy rate | 4WI/5WI | Boundary % | Dot-Ball % |
| Dale Steyn | 37 | 61 | 26.31 | 4.61 | 2/1 | 48.97 | 59.48 |
| Morne Morkel | 31 | 55 | 21.94 | 4.46 | 4/0 | 47.55 | 58.95 |
| Lasith Malinga | 46 | 77 | 24.71 | 4.49>/td> | 1/4 | 42.03 | 58.08 |
| Nuwan Kulasekara | 57 | 63 | 34.09 | 4.45 | 1/0 | 53.91 | 61.77 |