Analysing the unexplainable
Stats review of the England-India Test series, including a look at sequences by teams that were as bad as, or worse than, India's five-innings streak of sub-200 scores in the recently concluded Test series
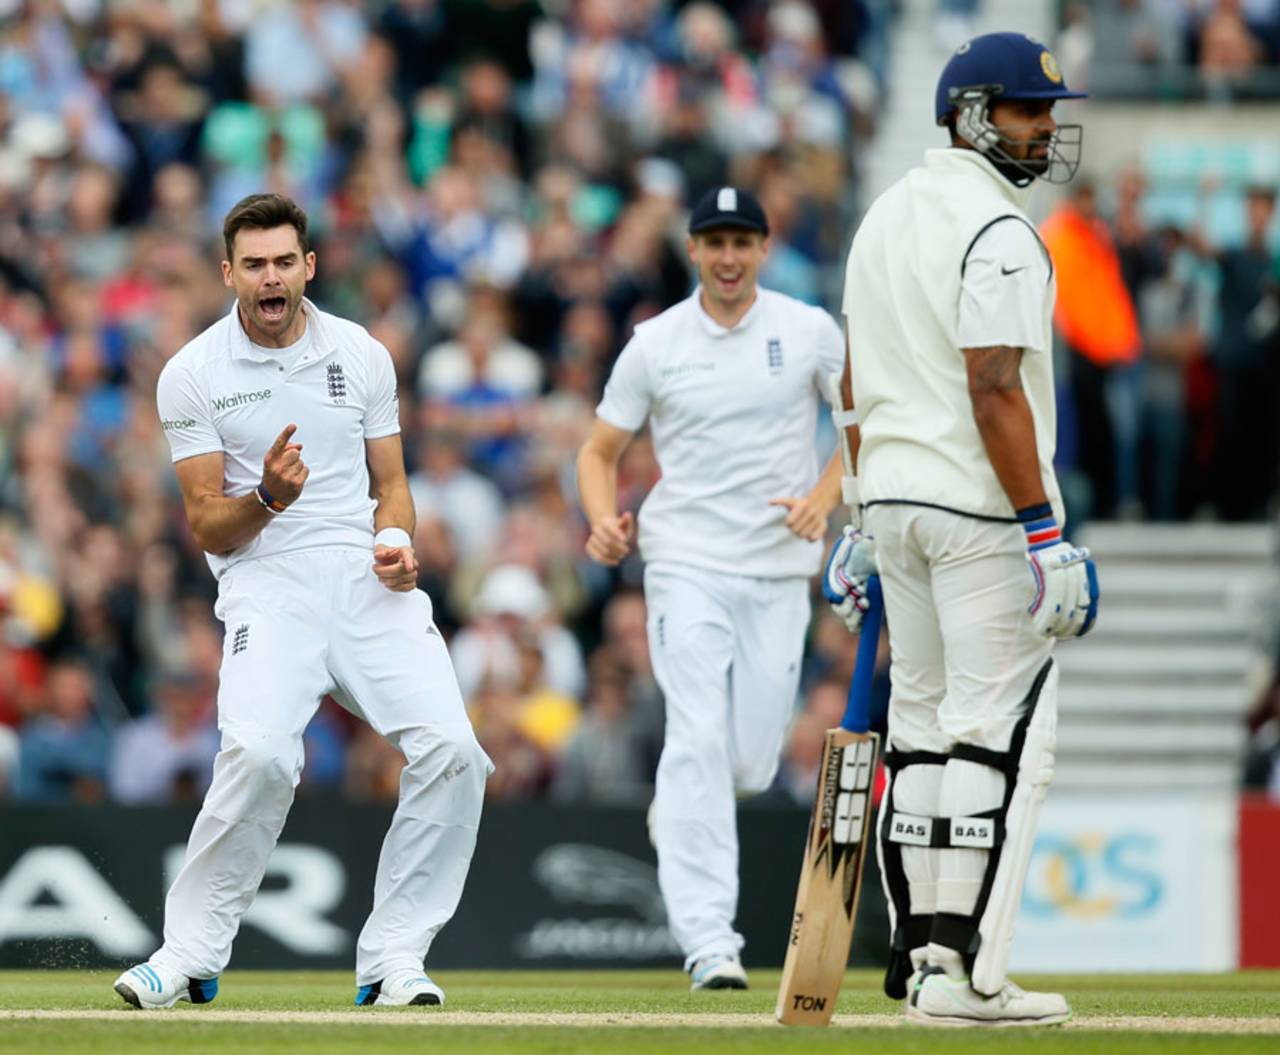
The Anderson-Vijay contest in the recent Test series could be called a draw, with neither clearly dominating • Associated Press
I had initially envisaged doing an exhaustive head-to-head analysis for the England-India Tests series. I have changed the emphasis of the article since Rajesh's complete statistical coverage of the series contains quite a few head-to-head numbers. I will still do a single table on what are the significant head-to-head confrontations. This will bring into focus where England gained and India lost.
Initially I will do a thorough analysis of the disastrous second half of the series, checking for some precedence during the many Tests which have been played so far.
By now everyone knows that India were dismissed for sub-200 totals in their last five innings. And some invisible forces made India go through the score of 66 for 6 in the last four innings. Henceforth India will not get shivers at 111 but at 66 too! My off-the-cuff take was that many teams would have gone through such a poor patch as five consecutive sub-200 innings.
First I considered only India matches. The two rules were simple. Consider all matches: home and away. Any innings in which fewer than ten wickets fell would break the sequence.
With the sorry state of Indian cricket during the first 25-30 years I expected at least two or three such sequences other than the current disaster achieved by a much-hyped team. Lo and behold! There was one such occurrence. Even though I knew that my program, inanimate though it is, would be angry at me, I was not sure about this and checked the entire lot of 483 matches. No, my trusted programming skills had not deserted me. There was only one other sequence: During the equally disastrous 1959 tour of England.
I was so fascinated by these two sequences occurring over half a century apart by two diametrically opposite teams that I decided to do a complete study. Mr Ravi Shastri would be well-advised to go through this article to know the tough task on hand: in Test matches. Let us now look at the comparisons in a table form.
| Description | India 2014 | India 1959 | Comments | |
|---|---|---|---|---|
| Runs | 733 | 800 | 1959 slightly better | |
| Avge Runs per innings | 146.6 | 160.0 | 1959 slightly better | |
| Overs | 246 | 378 | 1959 much better | |
| Avge Overs per innings | 49.2 | 76.6 | 2014 disaster | |
| Wickets | 50 | 50 | ||
| Avge RpW | 14.6 | 16.0 | 1959 slightly better | |
| Avge BpW | 29.4 | 45.4 | 2014 disaster | |
| Avge Opening partnership | 13.8 | 13.2 | Approximately same | |
| Sum of 1-5 bat scores | 288 | 539 | 1959 way better | |
| Avge of 1-5 batsmen (25) | 11.7 | 21.6 | 2014 disaster | |
| Sum of 6-11 bat scores | 396 | 232 | ||
| Avge of 6-11 batsmen (25) | 15.8 | 9.3 | 2014 tail wagged | |
| 50 Partnerships | 4 | 4 | Same | |
| Fifties | 3 | 2 | Similar | |
| Team Perf Points | 72 - 228 | 73 - 227 | Same | |
| Span of 5 Tests | 41 | 80 | 1959-time for FC matches |
The damning indictment of the current Indian team is there for everyone to see. It is quite possible that the 1959 team, during the entire year 1959, earned less than what Virat Kohli earns during the course of a single Test match. However, there is no escape from the following revealing facts.
- The 1959 team scored more runs during the five innings: Consequently averaged more runs per innings (160.0 against 146.6).
- Thereby the average RpW for the 1959 team was slightly better (16.0 against 14.6).
- The 1959 team had great defensive skills and lasted many more overs: Consequently averaged more overs per innings (76.6 against 49.2).
- In other words, the 1959 team gave their wickets away much more dearly: An average of 45.4 balls per wicket as against the 2014 team's 29.4.
- The aggregate of the 1-5 batsmen of the 1959 team was nearly double that of the 2014 team. The 1-5 batsmen of 1959 averaged 21.6 against 11.7.
- The two teams were comparable in the areas of average opening partnerships, number of 50 partnerships, number of 50 scores and were almost dead-heated on the Team Performance points measure.
- There was only one consolation for the 2014 team. Their late-order batsmen played much better. Else we might have seen five sub-100 scores. But then MS Dhoni was at No. 6. The figures would be different if 1-6 was taken but what does it matter? 1-5 is expected to be the core of batting.
- There was one big difference. The five Tests in 1959 were spread over 80 days. This time the lapsed period was halved to 40 days. The 1959 team played quite a few first-class matches in between Tests. But what prevented Dhoni, the cricket Czar of India, from putting his foot down and insisting on a four-Test series and a couple of first-class games sandwiched in between?
Let us look at the personnel involved. Pankaj Roy, Arvind Apte, Jayasinghrao Ghorpade, Chandu Borde, Polly Umrigar, Datta Gaekwad, Naren Tamhane compared to M Vijay, Shikhar Dhawan, Kohli, Cheteshwar Pujara, Ajinkya Rahane, Dhoni, R Ashwin. Struggling against pace bowling: both teams. Lack of experience: in both teams; First-class experience: quite high with the 1959 teams, very little with the current IPL-bred 2014 players. Where did/do the two teams go after the series? The 1959 team went back to a full first-class season and then a home series against a tough Australia team. The current lot through an ODI series to Champions League T20 and a home Tests series against a weak team. And then Australia beckon.
What about the bowlers? Fred Trueman, Brian Statham, Alan Moss and Harold Rhodes against James Anderson, Stuart Broad, Chris Jordan and Chris Woakes. Only a fool would say that the 1959 attack is not comparable to the 2014 attack. In both cases, two among the greatest England produced, supported by two average bowlers.
Okay, enough is enough. But there are other teams. Some of them could have got quite a few five-innings sequence of sub-200 scores. First, let me explain why I had to exclude the 134 Tests before 1920. Scores under 200 were the order of the day and many of these were match-winning ones. Two forty-four of the 484 innings were sub-200 ones. So, including these Tests would have given a completely distorted picture.
How many such sequences should we expect when we consider the 1900-plus Tests from 1921 onwards? There are already two to India's account. Maybe there are another ten more, because of the very poor New Zealand, West Indian and Bangladesh teams at different times. Maybe a couple from the other teams also. Even one from a strong team like Australia.
Well, I have news for all. There are only four such sequences. And half the teams have never suffered the ignominy of such a sequence. Let us see the listing of such teams.
Teams with five or more sub-200 innings scores in consecutive innings
India-1959       (160.0): 157, 168, 165, 161, 149.
India-2014       (146.6): 178, 152, 161, 168,  94.
New Zealand-1958 ( 91.3):  94, 137,  47,  74,  67, 129.
West Indies-1931 (124.0): 107,  90, 193, 148,  99, 107.
Bangladesh-2001  (153.8): 108, 132, 135, 160, 152, 148,
                          148, 161, 184, 164, 184, 170.
Australia-1979   (157.3): 111, 164, 160, 198, 143, 168.
We have already seen the two Indian sequences. New Zealand, during 1958, had a six-innings sequence, which was the worst in Test history. They had four sub-100 scores and averaged only 91 runs per innings. Right at the beginning of their Test days, West Indies had a six-innings sequence, averaging 124. Bangladesh, during the early years, had a 12-innings, yes, you read it right, streak of sub-200 scores at an average of 154. The point is that these were all decent sub-200 scores. Finally Australia, had a miserable six-innings sequence at an average of 158. They were shattered by the Packer defections and were a disorganised lot.
Needless to say that all these matches were lost by the teams concerned. And to close this topic, let me confirm that England, South Africa, Pakistan, Sri Lanka and Zimbabwe had no sub-200 sequences that were five innings long.
Now let me look at the head-to-head confrontations in the England-India series.
| Bowler | Team | Batsman | Balls | Runs | Wickets | Average | BpW | Strike Rate |
|---|---|---|---|---|---|---|---|---|
| England dominant | ||||||||
| RA Jadeja | Ind | GS Ballance | 215 | 83 | 1 | 83.0 | 215.0 | 38.6 |
| B Kumar | Ind | GS Ballance | 198 | 105 | 1 | 105.0 | 198.0 | 53.0 |
| I Sharma | Ind | JE Root | 167 | 112 | 1 | 112.0 | 167.0 | 67.1 |
| B Kumar | Ind | AN Cook | 156 | 67 | 1 | 67.0 | 156.0 | 42.9 |
| B Kumar | Ind | JE Root | 143 | 83 | 1 | 83.0 | 143.0 | 58.0 |
| STR Binny | Ind | GS Ballance | 60 | 64 | 0 | 64.0 | 60.0 | 106.7 |
| JM Anderson | Eng | V Kohli | 50 | 19 | 4 | 4.8 | 12.5 | 38.0 |
| SCJ Broad | Eng | CA Pujara | 69 | 20 | 3 | 6.7 | 23.0 | 29.0 |
| JM Anderson | Eng | S Dhawan | 78 | 32 | 3 | 10.7 | 26.0 | 41.0 |
| SCJ Broad | Eng | AM Rahane | 139 | 41 | 3 | 13.7 | 46.3 | 29.5 |
| Equal contests | ||||||||
| JM Anderson | Eng | M Vijay | 337 | 106 | 4 | 26.5 | 84.2 | 31.5 |
| India dominant | ||||||||
| JM Anderson | Eng | MS Dhoni | 187 | 96 | 2 | 48.0 | 93.5 | 51.3 |
| SCJ Broad | Eng | M Vijay | 266 | 88 | 1 | 88.0 | 266.0 | 33.1 |
| LE Plunkett | Eng | M Vijay | 182 | 63 | 1 | 63.0 | 182.0 | 34.6 |
| I Sharma | Ind | IR Bell | 40 | 19 | 3 | 6.3 | 13.3 | 47.5 |
| B Kumar | Ind | IR Bell | 106 | 46 | 3 | 15.3 | 35.3 | 43.4 |
I have decided to highlight the significant H-t-H confrontations only. Gary Ballance floored Ravindra Jadeja. He faced over 250 balls, played carefully and lost a wicket just once. Ballance also handled Bhuvneshwar Kumar very well. Nearly 200 balls, over 100 runs and a single dismissal. Joe Root handled Ishant Sharma the best of all English batsmen: 167 balls, an excellent strike rate and a single dismissal. Alastair Cook was quiet against Bhuvneshwar but gave England the start they needed by being out just once in over 25 overs. Even though Stuart Binny was a second-line bowler, Ballance took him apart and finished with the only 50-plus ball confrontation with a better than a run-a-ball strike rate.
Anderson toyed with Kohli. Fifty balls and four dismissals meant Kohli's innings rarely went beyond 40/50 balls. Pujara was slightly better than Kohli against Anderson but still gave away his wicket every 23 balls. If Anderson took care of the two best Indian batsmen, Broad took care of the second level quite well. He dismissed Dhawan once every 26 balls and Rahane once every 43 balls.
The English supremacy can finally be traced back to these confrontations: Anderson, Broad and Root against Kohli, Pujara, Dhawan, Rahane and Sharma.
Vijay handled Anderson reasonably well. One could call that contest a draw. It took Anderson 84 balls to dismiss Vijay but contained him well and the average was only 26.
Now we come to the rare contests which were won by India. M Vijay mastered both Broad and Liam Plunkett very well, especially his handling of Broad: 266 balls and a single wicket. Against Plunkett it was 182 balls and a single wicket. These were the contests that kept India in the series during the first two Tests. Dhoni handled Anderson quite well too: two wickets in 187 balls tell the story.
Ian Bell was a disaster against both Ishant Sharma and Bhuvneshwar. Ishant needed only just over two overs to dismiss Bell and Bhuvneshwar needed a few more balls: once every six overs. Bell's two good innings were after Ishant departed.
One final comment. The Lord's win was a great one, no doubt. However, most people forget that the Indian bowlers were clueless for all but one ball during the first session of the last day. If Moeen Ali had not been dismissed, there was a good chance (no less than 50-50) that England would have won the match. Who knows what would have happened after lunch? Even at the end it was only a 55-45 Test in favour of India, as shown by the performance analysis summary for the series. The final margin could easily have been 4-0 instead of 3-1. And let me say that the analysis presented in this article will not be diluted or invalidated even if India does well in the ODI series. Scores of 300-plus in one format do not make up for scores of sub-200 in another format.
(An aside: With AB de Villiers' extraordinary innings against Australia on August 27, there are four current ODI batsmen who are averaging in excess of 50. And these are four of the five batsmen who have achieved career averages over 50.)
England IndiaMy next article will be a landmark analysis and has been asked for over the past few weeks by many readers. It will incorporate dynamic team performance analysis, including floating number of Tests, opposition team strengths, location performances and recent form. After that article, all suppositions and conjectures should come to an end. The greatest period any Test team has gone through will be identified. It may very well be a 4-1 outsider: who knows?
Nottingham 39.4 34.5 (England had the better of the draw) Lord's 44.6 55.4 (95-run win for India) Southampton 63.8 36.2 (266-run win for England) Manchester 77.6 22.4 (Big innings win for England) Oval 86.2 13.8 (Huge win: by 3 innings and 2 runs) 311.6 162.3 (England, by a few miles)
Incidentally the 1959 series went 351 - 149 in England's favour.
Anantha Narayanan has written for ESPNcricinfo and CastrolCricket and worked with a number of companies on their cricket performance ratings-related systems