The greatest time to be an ODI batsman in a losing team
Yes, that is what the era we are living in will be known for
Andy Zaltzman
20-Feb-2016
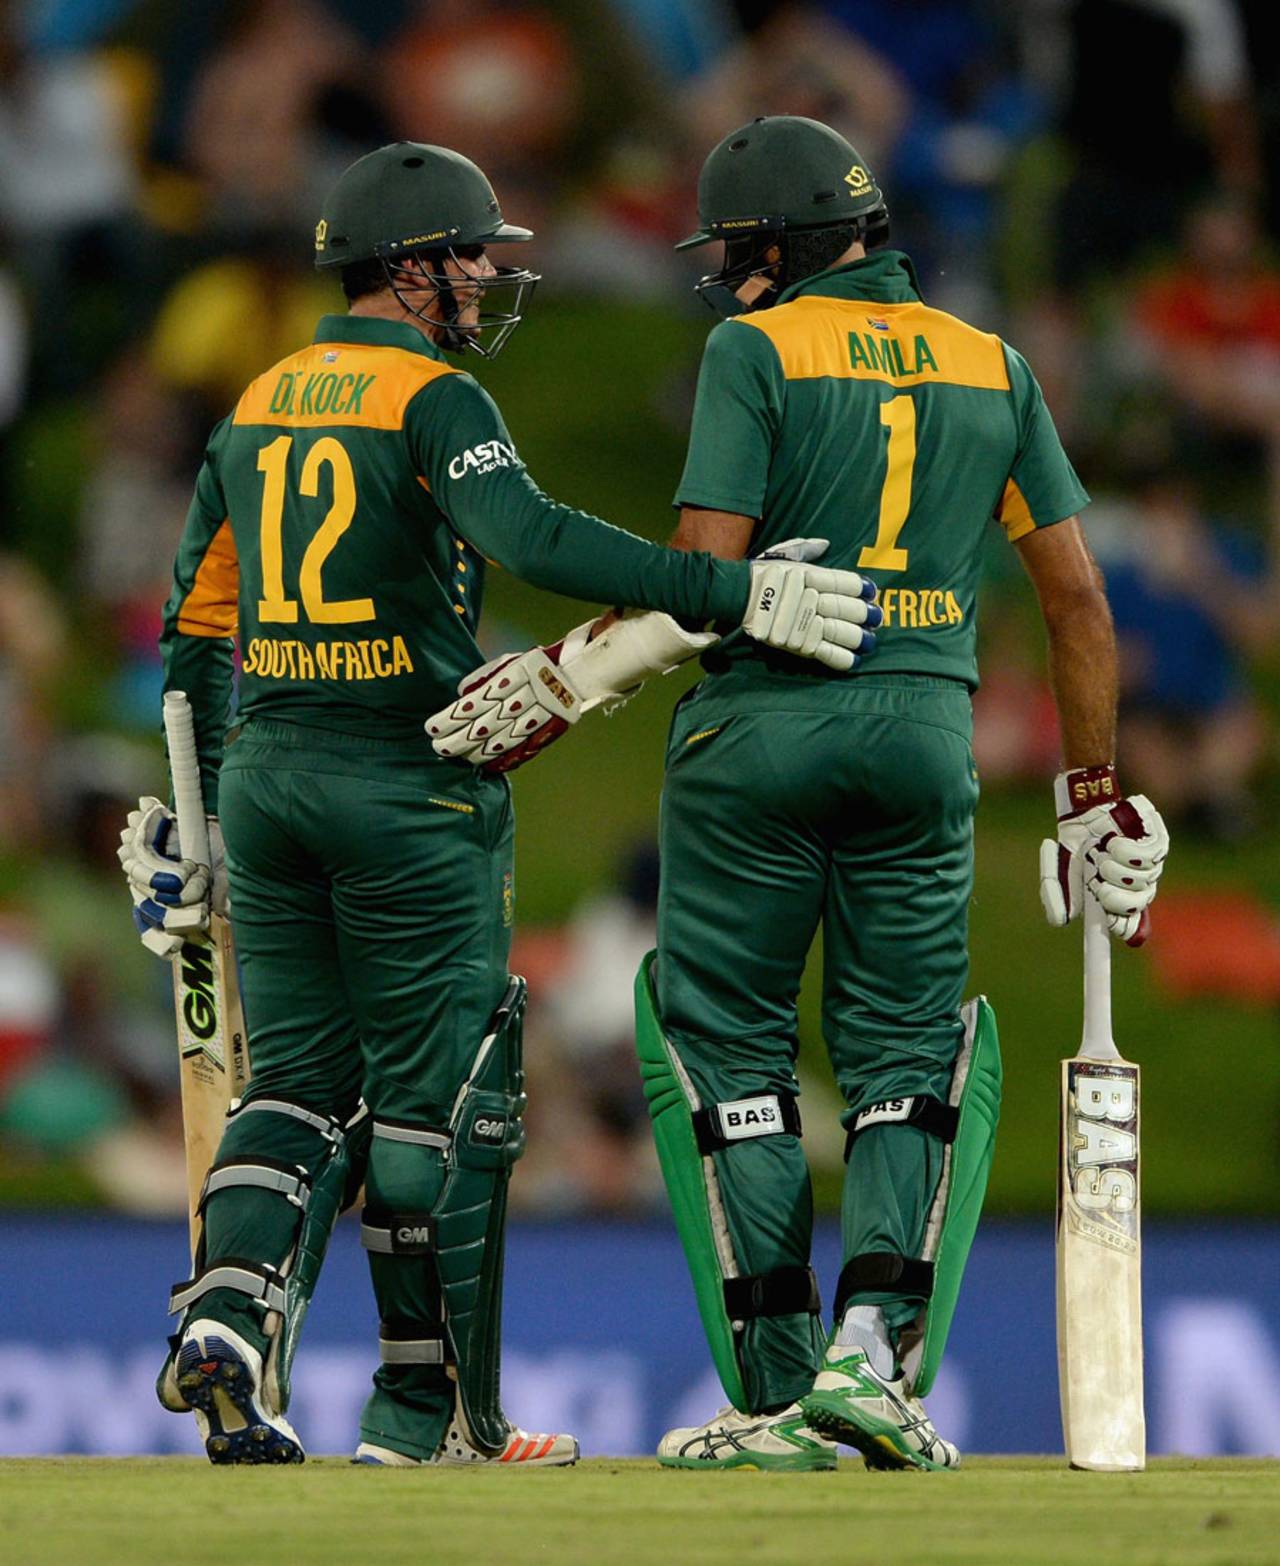
"A hundred every 5.7 innings? You're a better man than I, Gunga Din" • Getty Images
There have been 21 one-day internationals so far this year. In those 21 matches, 21 centuries have been scored. ODI cricket is touching the one-century-per-match mark. It is a phenomenon that may have passed relatively unnoticed amid the world's more pressing new stories, as the future of Europe hangs in a rather stroppy balance, Donald Trump cranks up his crankograph in an almost heroic effort to loon America into electoral submission, and the planet continues to shut its eyes and hope for the best in Syria, and areas affected by Syria, such as, for example, the rest of the world.
Nevertheless, the Confectionery Stall allows not its focus to be distracted by such passing political fads, and has been delving around in the entrails of some freshly sacrificed ODI stats to see what truths emerge. These rummagings have revealed not only that one-day-international hundreds are being tonked with record-shattering regularity, but also that, in the first seven weeks of the year, more centuries have been scored by batsmen on the losing team (12), than by winners (nine). By comparison, in 2015, victors reached three figures more than three times as often as losers (81 hundreds to 26), roughly in line with the all-time ratio of 2.9 ODI hundreds by victorious batsmen for every one scored by a defeated player (1077 to 370, up to the end of last year).
The eruption of hundred-scoring, aided by the fielding-regulations change of 2013, which stripped bowlers of a fifth boundary fielder (as well as hope, dignity and faith in a benevolent universe), has made Mount Vesuvius giving Pompeii the big boom boom look like a bottle of Coke opened by a nervous child after a bumpy bike ride. If I may exaggerate wildly.
Statistical seismologists studying the rumblings beneath the ODI world's crust might have seen this year's one-century-per-ODI stat coming. Last year, ODI hundreds were scored at one per 1.36 matches. In 2014, it was 1.53; in 2013, 1.77. In only one previous year had hundreds been scored more often than once every two matches - 55 centuries were scored in 108 ODIs in 1998, at one every 1.96 games. Currently, ODI hundreds are happening more than twice as regularly as they had done over the preceding four decades of the format's history.
There had been a gradual trend towards more ODI centuries in the years before 2013. From 2009 to 2012 inclusive, hundreds were scored once every 2.21 ODIs, down from one per 2.49 matches from 2001 to 2008. In the seven years prior to that, the figure was a hundred every 2.72 games. Nineteen ninety-one to 1993 was a bleak time for ODI hundred-makers - just one every 4.47 matches, down from one every 3.02 in the 1987-1990 period. From 1983 to 1986, as the ODI format grew rapidly around the world and Test-honed batsmen tried to adjust their games and expectations, there was just one century every 4.69 matches. Prior to that, in the early years of limited-over internationals, when many matches were 55 or 60 overs per side, hundreds occurred every 3.64 games.
Conversion rates have also rocketed upwards - 29% of one-day international fifties have been turned into centuries this year, up from 24% last year, 21% in 2013 and 2014, 16% from 2001 to 2012, and 13.5% in all ODIs up to and including the year 2000.
England showed that while they have advanced from their somewhat neanderthal World Cup batting strategy and now bat long and bat hard, they have not entirely forgotten how to bat stupid
These numbers are further proof that batsmen's understanding of what they can do to a cricket ball and, consequently, a cricket scoreboard, has been expanded by various factors in recent years, ranging from T20 and almost sadistically anti-bowler fielding regulations, to improved bats and supine pitches. Bowlers' understanding of what batsmen can do to them has been similarly expanded, and the hundred-makers have cashed in mercilessly.
Even in defeat. Among the features of England's brilliant come-from-in-front 2-3 anti-win over South Africa in the recent ODI series - a performance that simultaneously raised and lowered expectations, part of a grand ECB plan to ensure that England begin their home World Cup in 2019 as both genuine contenders and unfancied outsiders - was the centuries scored by Joe Root and Alex Hales in the three series-unclinching defeats.
England showed that while they have advanced from their somewhat neanderthal World Cup batting strategy and now bat long and bat hard, they have not entirely forgotten how to bat stupid. They left three excellent hundreds unsupported, and Root became the third player this year to score two losing centuries in a bilateral ODI series, after Rohit Sharma and Virat Kohli each posted three figures twice in India's four run-laden losses in Australia in January.
Previously, only five players had done so in ODI history - Sri Lanka's Roy Dias, who scored his only two ODI hundreds in defeats to India in 1982-83; Inzamam-ul-Haq for Pakistan against India in March 2004; Kevin Pietersen in his dazzling breakthrough series in South Africa early in 2005; Chris Gayle in the UAE against Pakistan in November 2008; and Brendan Taylor in Zimbabwe's series defeat against New Zealand in October 2011, in which, after two matches, he had scored 235 undefeated runs off 225 balls, yet still found himself 2-0 down. His problem was that his team-mates had also scored 235 runs. Between them. For 14 wickets, off 376 balls.
All in all, the first two months of 2016 have been the greatest time to be a ODI batsman on a losing team. Defeated players collectively are averaging 26.97 this year, comfortably the highest ever, and defeated top-four players are averaging over 40 - 40.21, to be precise. Only one previous ODI year has seen top-four losers even topping 30, and that year was 1971, when only one match (the first ever ODI) was played (and even that was played accidentally). The next best year average for losing ODI top-four players is 1987, when they averaged 28.72.
So what does all this mean for the one-day game? I don't know - I have been staring at big tables of numbers of no real relevance to anything relevant for longer than is psychologically advisable.
There have been some brilliant high-scoring matches recently, and other rather uninteresting ones. South Africa won that thrillingly exciting and flawed medium-scoring fourth ODI thanks to a clutch of useful 20s and 30s, and a decisive 62 by Chris Morris. As with Test cricket, ODI cricket ought and needs to be competitive, balanced, meaningful and varied.
The temptations of scoreboard-melting, commentator-hyperbolicalising modern-day mega-thwackery are - as is so often the case with temptations - tempting. ODI batsmen have things too easy at the moment, and when individual hundreds and team 350s become commonplace, the delicate competitive ecosystem on which cricket depends risks being compromised.
However, as was revealed in South Africa's stirring comeback (and as we see repeatedly in the Test game in this age of giant scores and fast-action collapses), batsmen's flaws remain, and bowlers, when given fair opportunity, can still exploit them. Two hundred and twenty versus 221 for 9 is as gripping as 400 versus 395. That said, 220 versus 221 for 1 is less fun to watch than 400 versus 195. The genie of modern destructive strokeplay is not merely out of the bottle, it is singing "I Am What I Am" on a karaoke machine in the pavilion bar. It is a wondrous spectacle. But cricket should remember that what makes the wondrous wonderful is that it provokes wonder. In 1973, when ODI cricket was in its long infancy, British glam rockers Wizzard wished that it could be Christmas every day. Despite the success of their hit single, the government rejected their request, and Christmas remained a once-a-year event, albeit with the compromise of an extended two-month build-up.
Wizzard's no doubt well-intended perma-festivities would have proved economically ruinous, divorce-provokingly stressful for families, and psychologically damaging for children unable to cope with the non-stop deluge of presents, curious jumpers and forced bonhomie. Similarly, wishing that there could be an ODI hundred every match would do no favours to a format that, at its best, remains exciting, testing and important to the sport's future.
Some more ODI Batting Bonanza stats:
● Top-four batsmen have scored 19 of this year's centuries, at a rate of one every 8.6 innings - better than Sachin Tendulkar managed over the course of his career. Last year the figure was one per 12.7 innings. In 2013 and 2014 combined, it was 14.8. From 2000 to 2012, top-four batsmen managed a hundred every 21.5 innings, and in all ODIs in the second millennium, they scored a century every 27.4 innings.
● Seventy-eight players have scored six or more ODI hundreds. In terms of innings per century, the top seven most frequent hundred-makers are all current players. Quinton de Kock leads the way, having scored ten hundreds in 57 ODI innings (one per 5.7 innings), followed by Hashim Amla (22 hundreds, one per 5.8 innings), Virat Kohli (25, 6.5), Aaron Finch (7, 7.9), Joe Root (8, 8.0), AB de Villiers (24, 8.0), and Shikhar Dhawan (9, 8.1).
Next on the list, and one of only three in the top 20 not to have played an ODI this decade, is Zaheer Abbas, who hit seven hundreds in his 60 ODI innings, from 1974-1985, at a remarkable rate of one every 8.6 innings, phenomenal for the time. Tendulkar, whose 49 ODI hundreds came at a rate of one per 9.2 innings, is next, and the surprise final member of the top ten is Naughty Naughty Salman Butt, with eight hundreds in 78 ODI innings.
| Player | Span | Inns | Ave | 100s | Inns/100 |
| Quinton de Kock | 2013-2016 | 57 | 42.94 | 10 | 5.7 |
| Hashim Amla | 2008-2016 | 128 | 52.13 | 22 | 5.8 |
| Virat Kohli | 2008-2016 | 163 | 51.51 | 25 | 6.5 |
| AJ Finch | 2013-2016 | 55 | 38.48 | 7 | 7.9 |
| JE Root | 2013-2016 | 64 | 44.34 | 8 | 8.0 |
| AB de Villiers | 2005-2016 | 192 | 54.56 | 24 | 8.0 |
| Shikhar Dhawan | 2010-2016 | 73 | 43.97 | 9 | 8.1 |
| Zaheer Abbas | 1974-1985 | 60 | 47.62 | 7 | 8.6 |
| Sachin Tendulkar | 1989-2012 | 452 | 44.83 | 49 | 9.2 |
● The margin between winning players' collective batting average and that of losing teams is currently narrower - 43% (38.5 versus 26.9) - than in any ODI year since 1980, when only 21 matches were played. In 2015, winners averaged more than twice as much as losers (46.3 to 22.3), and the margin has generally been between 80 and 100% throughout ODI history. The strike-rate advantage of winning teams over their opponents in this year's early ODI skirmishes is only 6%, well below the 15-25% range recorded in most previous years.
● Five of the 21 ODIs played this year have seen both sides score at least 300. This only happened four times in the first 1278 ODIs played, from 1971 to January 1998. In all, 63 of the 92 double-300 one-dayers have taken place since January 2007.
Andy Zaltzman is a stand-up comedian, a regular on BBC Radio 4, and a writer