When strike bowlers led the batting averages
Stats highlights from a riveting Test series between South Africa and Australia
S Rajesh
22-Nov-2011
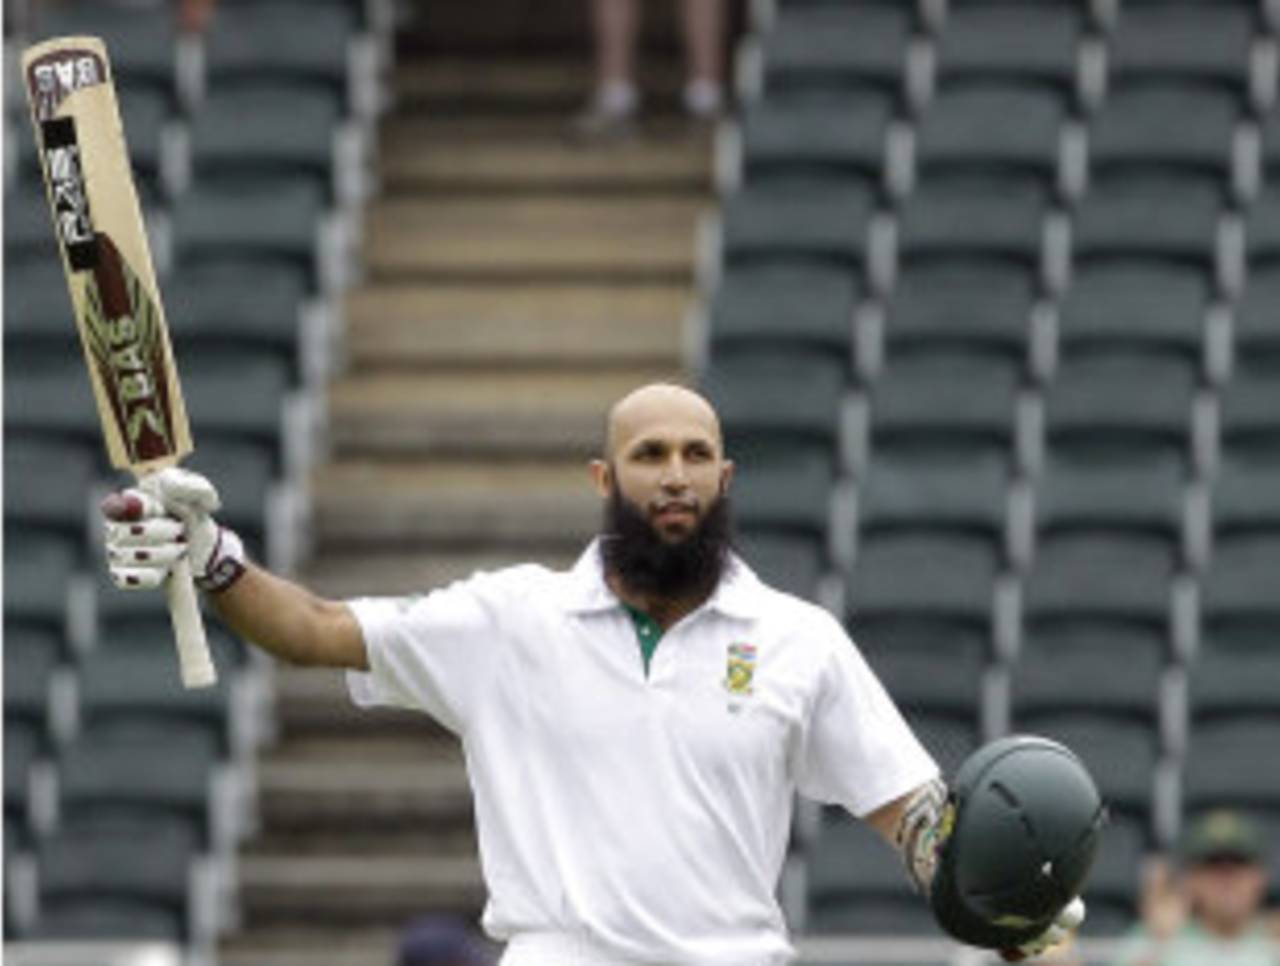
Hashim Amla was the only batsman to score more than 200 runs in the series • Associated Press
Tough on batsmen
To say that it was a difficult series for the batsmen would be a huge understatement. The top orders from both sides struggled in conditions that were superb for fast bowling, and it's reflected in the series averages: Australia averaged 24.65, and South Africa 29.28. The numbers below also reflect how closely matched the two teams were: they scored exactly the same number runs, and there was hardly any difference in the scoring rates too, though Australia lost six more wickets in doing so. Overall in the series, a wicket fell every 7.2 overs, which means about 12 fell on average in a 90-over day.
The averages charts reiterate this: for Australia, Michael Clarke was the only top-order batsman to average more than 40, while Ricky Ponting and Michael Hussey both averaged less than 20. Even with Clarke, 151 out of his 166 runs came in one innings, an exceptional effort in the first innings of the first Test. For South Africa, the top batting numbers look a little better: Hashim Amla was the only batsman from either team to score more than 200 runs in the series, while Graeme Smith's unbeaten century in the first Test run-chase lifted his average to 61.67. Amla's series average of 59.75 means he has averaged 50 or more in seven of his last 11 series. During this period, only three batsmen have scored 2500-plus runs at a higher average.
However, South Africa's middle-order mainstay of several years, Jacques Kallis, didn't enjoy as much success, scoring only 58 runs at 19.33. Those 58 runs came in only 70 deliveries, which is the fewest deliveries Kallis has ever faced in a Test series in his entire career. The series strike rate of 82.85 is his second-highest. It's also a far-cry from his first home series against Australia in 1996-97, when he'd scored all of 49 runs in 238 deliveries at an average of 9.80 and a strike rate of 20.58.
In this series, the batting averages for both teams were headed by their leading strike bowlers (though one of them didn't live up to that tag). Mitchell Johnson averaged 50.50 with the bat, but more importantly, scored runs when his team badly needed them. With the ball, though, he did more harm than good, averaging 85 for each of his three wickets at an economy rate of 4.10. Dale Steyn scored 65 and was dismissed just once in the series, but he did justice to his primary suit too, taking 11 wickets at 21.81.
| Team | Runs scored | Dismissals | Average | Run-rate | 100s/ 50s |
| South Africa | 937 | 32 | 29.28 | 3.66 | 3/ 4 |
| Australia | 937 | 38 | 24.65 | 3.65 | 1/ 5 |
The partnership stats are also pretty uneven for both teams. Australia have a higher first-wicket average, though that's entirely due to the 174-run stand between Shane Watson and Phillip Hughes in the first innings in Johannesburg. The Amla-Smith stand during the run-chase in Cape Town pushes up the overall second-wicket stats for South Africa, while AB de Villiers made a couple of key contributions too in the middle order.
| Wicket | SA - Average | 100/ 50 stands | Aus - Average | 100/ 50 stands |
| 1st | 28.75 | 0/ 0 | 46.75 | 1/ 0 |
| 2nd | 68.50 | 1/ 0 | 12.00 | 0/ 0 |
| 3rd | 36.33 | 0/ 1 | 38.00 | 1/ 0 |
| 4th | 59.00 | 1/ 0 | 31.50 | 1/ 0 |
| 5th | 41.33 | 1/ 0 | 13.25 | 0/ 0 |
| 6th | 5.67 | 0/ 0 | 15.75 | 0/ 1 |
| 7th | 2.00 | 0/ 0 | 34.00 | 0/ 1 |
The head-to-head battles
Though this was only a two-Test series, there were still some interesting head-to-head numbers that emerged. Hughes averaged 29.25 in the series, but clearly won his battle against Dale Steyn, scoring 42 at run-a-ball against him over the entire series. Steyn didn't dismiss Clarke either, but got rid of Ricky Ponting twice in 57 deliveries.
The impressive Vernon Philander, on the other hand, had plenty of success against both Hughes and Clarke, with combined figures of 5 for 60 against them. Michael Hussey's series, on the other hand, was spoiled by Morne Morkel, who dismissed him twice for only 17 runs.
Johnson was supposed to be Australia's strike bowler, but he didn't make much of an impression on the South African batsmen. Amla scored 88 from 98 deliveries off him, which is the most runs scored by a batsman off one bowler in the series. Smith enjoyed batting against him too, scoring 52 off 74 balls, while Jacques Rudolph helped himself to 39 off 40.
Amla was, quite surprisingly, kept on a tight leash by Peter Siddle, though he couldn't achieve the same sort of control against Smith. His stats against Kallis, though, are perhaps the quirkiest in a bowler-dominated series: in 14 deliveries, Kallis scored 26 runs off him, but still managed to get out to him once.
| Batsman | Bowler | Runs | Balls | Dismissals | Average | Run rate |
| Phil Hughes | Dale Steyn | 42 | 42 | 0 | - | 6.00 |
| Michael Clarke | Dale Steyn | 40 | 62 | 0 | - | 6.00 |
| Ricky Ponting | Dale Steyn | 24 | 57 | 2 | 12.00 | 2.52 |
| Phil Hughes | Vernon Philander | 29 | 58 | 3 | 9.66 | 3.00 |
| Michael Clarke | Vernon Philander | 31 | 56 | 2 | 15.50 | 3.32 |
| Michael Hussey | Morne Morkel | 17 | 38 | 2 | 8.50 | 2.68 |
| Hashim Amla | Mitchell Johnson | 88 | 98 | 2 | 44.00 | 5.38 |
| Hashim Amla | Peter Siddle | 30 | 131 | 0 | - | 1.37 |
| Graeme Smith | Peter Siddle | 55 | 65 | 0 | - | 5.07 |
| Jacques Rudolph | Mitchell Johnson | 39 | 40 | 0 | - | 5.85 |
| Jacques Kallis | Peter Siddle | 26 | 14 | 1 | 26.00 | 11.14 |
S Rajesh is stats editor of ESPNcricinfo. Follow him on Twitter