Kapil, Gilmour and Aravinda take the cake
A look at the best batting, bowling, allround, and team performances in the previous ten World Cups.
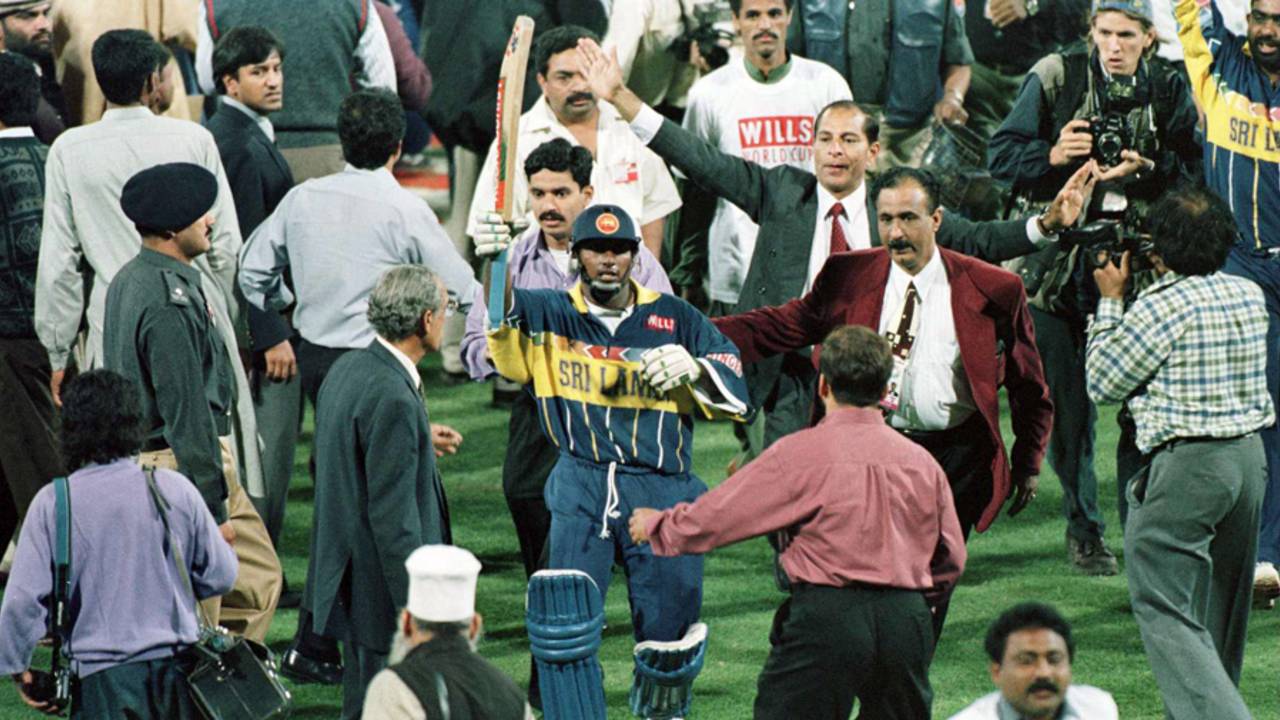
Aravinda de Silva's effort in the finals of 1996 final is the best all-round performance in the World Cups. • Getty Images
A brief introduction into the methodology of Performance Analysis.
The Batting Performance Ratings analysis takes into account the Runs scored, Balls faced, Next highest score (if this is the highest score), % of Team score, Innings status at entry, Bowling quality, Pitch information, Team strengths, Target score in front, Match location, Result and Match importance. These parameters are given appropriate weights. The calculations are done in such a way that Rating points of 1000 would be allotted to a mind-blowing and match-winning score of 200 in 150 balls in a WC final.
The Bowling Performance Ratings analysis takes into account the Wickets captured, Quality of batsmen dismissed, Scores at which batsmen were dismissed, Bowling accuracy, Batting quality, Pitch information, Team strengths, Target being defended, Match location, Result and Match importance. The calculations are done in such a way that Rating points of 1000 would be allotted to a magnificent and match-winning analysis of 10-2-15-6 in a WC final.
The Player Performance Ratings analysis takes into account the Batting Rating points, Bowling Rating points and the Fielding Rating points, which is a combination of catches and stumpings. There are minimum criteria for batting and bowling stints to ensure that these are genuinely all-round performances.
The Team Performance Ratings analysis takes into account the Result, Margin of win, Resources utilized, Team strengths, Match location and Match importance. The calculations are done in such a way that Rating points of 1000 would be allotted to an overwhelming win by 150 runs or 8 wickets in a WC final.
Now we come to the creme la creme. The best of the best. Let us move on to the Performance Analysis tables across all ten World Cups.
| SNo | Rating Pts | Year | ODI# | Batsman | For | Vs | Runs | Balls |
|---|---|---|---|---|---|---|---|---|
| 1 | 810 | 2007 | 2581 | AC Gilchrist | Australia | Slk | 149 | 104 |
| 2 | 738 | 1983 | 216 | N Kapil Dev | India | Zim | 175* | 138 |
| 3 | 651 | 1979 | 74 | IVA Richards | West Indies | Eng | 138* | 157 |
| 4 | 616 | 2003 | 1993 | RT Ponting | Australia | Ind | 140* | 121 |
| 5 | 594 | 2007 | 2555 | ML Hayden | Australia | Win | 158 | 143 |
| 6 | 576 | 2003 | 1945 | A Symonds | Australia | Pak | 143* | 125 |
| 7 | 546 | 1996 | 1083 | PA de Silva | Sri Lanka | Aus | 107* | 124 |
| 8 | 533 | 1999 | 1463 | SC Ganguly | India | Slk | 183 | 158 |
| 9 | 526 | 2003 | 1944 | SB Styris | New Zealand | Slk | 141 | 125 |
| 10 | 523 | 2011 | 3100 | V Sehwag | India | Bng | 175 | 140 |
| 11 | 516 | 1987 | 457 | IVA Richards | West Indies | Slk | 181 | 125 |
| 12 | 514 | 1987 | 454 | DL Houghton | Zimbabwe | Nzl | 142 | 137 |
| 13 | 514 | 1975 | 33 | CH Lloyd | West Indies | Aus | 102 | 85 |
| 14 | 496 | 1987 | 476 | GA Gooch | England | Ind | 115 | 136 |
| 15 | 492 | 2007 | 2547 | Imran Nazir | Pakistan | Zim | 160 | 121 |
| 16 | 490 | 1992 | 747 | Rameez Raja | Pakistan | Nzl | 119* | 155 |
| 17 | 485 | 2011 | 3110 | AJ Strauss | England | Ind | 158 | 145 |
| 18 | 478 | 2007 | 2579 | DPMD Jayawardene | Sri Lanka | Nzl | 115* | 109 |
| 19 | 473 | 2003 | 1955 | SP Fleming | New Zealand | Saf | 134* | 132 |
| 20 | 464 | 2007 | 2567 | AB de Villiers | South Africa | Win | 146 | 130 |
The table is led by the powerful and match-winning hundred by Adam Gilchrist. From ball one, he was intent on stamping his authority on the strong bowling attack and he did so, as only he could do. The reasons why this performance is at the top are the importance of the match, the number of runs, the strike rate, the quality of Sri Lankan bowling, the domination within Australian innings et al. Gilchrist's innings rates at a very high 810 points, second only to Viv Richards' 189 in the all-time stakes.
In second place is Kapil Dev's 175. This has been repeated ad infinitum, but needs saying again. Coming in at 9 for 4, seeing the score move to 17 for 5, having only the late order batsmen with him, Kapil Dev went on to score the bravest and most valuable ODI innings ever. This is one innings the other top ODI batsmen would have liked to have played. The main reasons for this exalted position are the innings position at entry, slump afterwards, huge number of runs scored, the scoring rate and the number of runs added with the late order batsmen. Kapil's innings, although played in an ordinary league match, rates at 738 points.
Richards' beautifully paced 138 in the 1979 final comes in next. The importance of the match, the way Richards controlled the innings and took West Indies to a very good score, the quality of English bowling were amongst the reason why this innings is rated as the third best World Cup innings ever. This innings rates at 651 points, some distance away from Kapil's innings.
Then comes Ricky Ponting's dominating hundred in the 2003 final. With supporting innings from all the other batsmen, Ponting helped Australia reach a dominant score of 359. At half way stage there was only one winner. And this was due to Ponting's quick hundred. Almost all the reasons given for Gilchrist apply to Ponting's innings.
In fifth place comes Matthew Hayden's magnificent 158 against West Indies in the 2007 World Cup. A quick match-winning innings against the home team in the super-eights league puts him in fifth place. The next best innings was more than a hundred runs away.
Let us now look at the next five positions. Andrew Symonds' 143 was played at No. 6, coming in at 86 for 4 and with very little late order support. One of the late-order classics. Then comes the Aravinda de Silva masterpiece in the 1996 final against fancied Australia. Never flustered, determined to stay there till the end, in a very important match. Sourav Ganguly's 183 was made against the good quality bowling of Sri Lanka. It was also a huge innings. Scott Styris' 141 was played in a tough chase against Sri Lanka. Styris came in at 2 for 2 and scored 141 out of 225. Finally Virender Sehwag's 175 was played away against Bangladesh in the 2011 World Cup.
| SNo | Rating Pts | Year | ODI# | Bowler | For | Vs | Analysis |
|---|---|---|---|---|---|---|---|
| 1 | 908 | 1975 | 31 | GJ Gilmour | Australia | Eng | 12.0 - 6 - 14 - 6 |
| 2 | 788 | 2003 | 1976 | AJ Bichel | Australia | Eng | 10.0 - 0 - 20 - 7 |
| 3 | 721 | 2003 | 1986 | SE Bond | New Zealand | Aus | 10.0 - 2 - 23 - 6 |
| 4 | 586 | 1975 | 33 | GJ Gilmour | Australia | Win | 12.0 - 2 - 48 - 5 |
| 5 | 569 | 2003 | 1969 | A Nehra | India | Eng | 10.0 - 2 - 23 - 6 |
| 6 | 568 | 1992 | 748 | EA Brandes | Zimbabwe | Eng | 10.0 - 4 - 21 - 4 |
| 7 | 565 | 2011 | 3147 | Wahab Riaz | Pakistan | Ind | 10.0 - 0 - 46 - 5 |
| 8 | 558 | 1992 | 730 | MW Pringle | South Africa | Win | 8.0 - 4 - 11 - 4 |
| 9 | 555 | 1979 | 74 | J Garner | West Indies | Eng | 11.0 - 0 - 38 - 5 |
| 10 | 532 | 1999 | 1483 | SK Warne | Australia | Saf | 10.0 - 4 - 29 - 4 |
| 11 | 496 | 1999 | 1476 | BKV Prasad | India | Pak | 9.3 - 2 - 27 - 5 |
| 12 | 490 | 2003 | 1965 | CO Obuya | Kenya | Slk | 10.0 - 0 - 24 - 5 |
| 13 | 485 | 1999 | 1483 | SM Pollock | South Africa | Aus | 9.2 - 1 - 36 - 5 |
| 14 | 483 | 1983 | 207 | KH MacLeay | Australia | Ind | 11.5 - 3 - 39 - 6 |
| 15 | 479 | 2011 | 3110 | TT Bresnan | England | Ind | 10.0 - 1 - 48 - 5 |
| 16 | 474 | 2007 | 2573 | NW Bracken | Australia | Slk | 9.4 - 3 - 19 - 4 |
| 17 | 472 | 1983 | 214 | ALF de Mel | Sri Lanka | Nzl | 12.0 - 4 - 32 - 5 |
| 18 | 470 | 2007 | 2574 | AJ Hall | South Africa | Eng | 10.0 - 2 - 18 - 5 |
| 19 | 459 | 2003 | 1973 | WPUJC Vaas | Sri Lanka | Win | 10.0 - 3 - 22 - 4 |
| 20 | 458 | 1983 | 223 | S Madan Lal | India | Win | 12.0 - 2 - 31 - 3 |
For once let us look at the top-two bowling performances together. Gary Gilmour's mesmerising spell and Andy Bichel's outstanding spell are not just No. 1 and No. 2 in the World Cup stakes. These are also the top two bowling efforts in the all-time ODI stakes also. Let us see where Gilmour gets the edge.
Both bowlers have high number of wickets, dismissed top order batsmen, bowled against good batting sides and were very economical. Where Bichel scored was in the extra wicket and a better peer bowling accuracy. But Gilmour more than made up for this to create the 100 point gap. What favoured Gilmour was the match importance, dismissal of all six batsmen, including the top-five, in single figures and a better bowling accuracy. But let us conclude by saying that these were two of the greatest bowling performances ever in any limited over match.
Then comes Shane Bond's top-quality spell of 6 for 23 against Australia. He dismissed four top batsmen and two allrounders and helped dismiss Australia for a low score. Unfortunately New Zealand lost. If they had won, Bond could have come closer to Bichel.
Gilmour followed his semi-final masterpiece with another wonderful performance in the 1975 final. He dismissed Alvin Kallicharran, Rohan Kanhai, Clive Lloyd, Richards and Deryck Murray. The importance of the match and the quality of batsmen dismissed pushed him to fourth place. If Australia had won, Gilmour would have gone close to Bond.
In fifth place is Ashish Nehra's spell almost identical to Bond's. He captured 6 for 23 and helped India win. It must be said that the whole team bowled quite well.
Eddo Brandes' lovely spell capturing four top-order wickets for 21 runs in a great upset win over England is in sixth place. Wahab Riaz's potentially match-winning spell against India in the 2011 semi-final appears next. Very important match it was also. Myrick Pringle's top-order demolition of West Indies appears next. Brian Lara for 9, Richie Richardson for 1, Carl Hooper and Keith Arthurton for 0 is one heck of a collection. In ninth position is Joel Garner's 5 for 38 in the 1979 World Cup final. Garner destroyed the English middle-order. Finally appears Shane Warne's magical spell of four wickets in that crucial tie against South Africa, which took Australia to the final and on to the World Cup win.
| SNo | Rating Pts | Year | ODI# | Player | For | Vs | Runs | Balls | Analysis |
|---|---|---|---|---|---|---|---|---|---|
| 1 | 1059 | 1975 | 31 | GJ Gilmour | Australia | Eng | 28* | 28 | 12.0-6-14-6 |
| 2 | 933 | 1996 | 1083 | PA de Silva | Sri Lanka | Aus | 107* | 124 | 9.0-0-42-3 |
| 3 | 919 | 2003 | 1976 | AJ Bichel | Australia | Eng | 34* | 36 | 10.0-0-20-7 |
| 4 | 645 | 1975 | 33 | CH Lloyd | West Indies | Aus | 102 | 85 | 12.0-1-38-1 |
| 5 | 623 | 1983 | 199 | DAG Fletcher | Zimbabwe | Aus | 69* | 84 | 11.0-1-42-4 |
| 6 | 595 | 2007 | 2560 | ST Jayasuriya | Sri Lanka | Win | 115 | 101 | 8.3-0-38-3 |
| 7 | 591 | 2011 | 3125 | TM Dilshan | Sri Lanka | Zim | 144 | 131 | 3.0-1- 4-4 |
| 8 | 589 | 1999 | 1477 | NC Johnson | Zimbabwe | Aus | 132* | 144 | 8.0-0-43-2 |
| 9 | 584 | 2003 | 1973 | WPUJC Vaas | Sri Lanka | Win | 28* | 25 | 10.0-3-22-4 |
| 10 | 580 | 1999 | 1468 | NC Johnson | Zimbabwe | Saf | 76 | 117 | 8.0-1-27-3 |
| 11 | 562 | 1983 | 223 | S Madan Lal | India | Win | 17 | 27 | 12.0-2-31-3 |
| 12 | 560 | 1975 | 33 | KD Boyce | West Indies | Aus | 34 | 37 | 12.0-0-50-4 |
| 13 | 514 | 2003 | 1969 | A Flintoff | England | Ind | 64 | 73 | 10.0-2-15-2 |
| 14 | 508 | 2007 | 2578 | MP Vaughan | England | Win | 79 | 68 | 10.0-0-39-3 |
| 15 | 489 | 2007 | 2557 | SB Styris | New Zealand | Win | 80* | 90 | 10.0-1-35-1 |
| 16 | 488 | 1983 | 202 | Abdul Qadir | Pakistan | Nzl | 41* | 68 | 12.0-4-21-4 |
| 17 | 487 | 1999 | 1453 | GM Hamilton | Scotland | Pak | 76 | 111 | 10.0-1-36-2 |
| 18 | 485 | 1983 | 223 | M Amarnath | India | Win | 26 | 80 | 7.0-0-12-3 |
| 19 | 473 | 2011 | 3104 | RN ten Doeschate | Netherlands | Eng | 119 | 110 | 10.0-0-47-2 |
| 20 | 471 | 2011 | 3142 | Mohammad Hafeez | Pakistan | Win | 61* | 64 | 10.0-3-16-2 |
Gilmour and Bichel appear again, but separated by de Silva. It is very difficult to question placement of Gilmour's all-round performance at the top. After capturing 6 for 14 to dismiss England for a low score of 93, Gilmour would not have thought of putting on the pads. But in the space of 20 overs, Australia were down in the dumps at 38 for 6 and an embarrassing defeat looked likely. Gilmour walked in and scored an absolutely invaluable run-a-ball 28 and took Australia to a 4-wicket win, in the company of Walters. This all-round performance fetched Gilmour over 1000 Rating points.
Aravinda de Silva produced, arguably, the most valuable all-round performance in history of ODI cricket in the 1996 final. He dismissed Mark Taylor, Ponting and Ian Healy for 42 runs, to restrict Australia to 241. He also took two catches. Then de Silva controlled the chase beautifully with a quick hundred. This was done unhurriedly despite the loss of two early wickets. This earns de Silva 933 Rating points.
Bichel faced a situation almost bizarrely identical to Gilmour's. His 7 for 20 restricted England to 204. Australia never settled down and against Andy Caddick and Ashley Giles, slumped to 135 for 8. However the master finisher, Michael Bevan was still there. But it needed Bichel to attack at the other hand with a near-run-a-ball 34 and take Australia to a 2-wicket win. In both cases, Gilmour and Bichel saw their team through. This fetches Bichel 919 rating points, very close to de Silva.
In fourth place is Lloyd's all-round performance against Australia in the 1975 final. After scoring a whirlwind 102, Lloyd bowled 12 controlled overs of medium pace and was the perfect foil to Keith Boyce. He conceded only just above 3 runs per over. The fact that Australia fell short only by 17 runs shows how valuable Lloyd's spell was.
In fifth place is Duncan Fletcher's four top-order Australian wickets for 42 and match-winning 69. This was one of the greatest upsets in World Cup history.
The positions 6-10 are completed by Sanath Jayasuriya's hundred and three wickets against West Indies during 2007, Tillakaratne Dilshan's 144 and 4 for 4 against Zimbabwe during 2011, two performances during 1999 by Neil Johnson against the might of Australia and South Africa and Chaminda Vaas's cameo of 28 and four-wicket haul during 2003 against West Indies.
| SNo | Rating Pts | Year | ODI# | Team | Own score | Vs | Other score |
|---|---|---|---|---|---|---|---|
| 1 | 859 | 1999 | 1484 | Australia | 133 for 2 in 20.1 | Pak | 132 for 10 in 39.0 |
| 2 | 818 | 1983 | 223 | India | 183 for 10 in 54.4 | Win | 140 for 10 in 52.0 |
| 3 | 797 | 2003 | 1993 | Australia | 359 for 2 in 50.0 | Ind | 234 for 10 in 39.2 |
| 4 | 783 | 1996 | 1083 | Sri Lanka | 245 for 3 in 46.2 | Aus | 241 for 7 in 50.0 |
| 5 | 782 | 2007 | 2575 | Sri Lanka | 81 for 2 in 10.0 | Ire | 77 for 10 in 27.4 |
| 6 | 774 | 2011 | 3101 | New Zealand | 72 for 0 in 8.0 | Ken | 69 for 10 in 23.5 |
| 7 | 773 | 2007 | 2570 | Australia | 92 for 1 in 12.2 | Ire | 91 for 10 in 30.0 |
| 8 | 770 | 2011 | 3118 | West Indies | 59 for 1 in 12.2 | Bng | 58 for 10 in 18.5 |
| 9 | 765 | 2011 | 3142 | Pakistan | 113 for 0 in 20.5 | Win | 112 for 10 in 43.3 |
| 10 | 761 | 1979 | 74 | West Indies | 286 for 9 in 60.0 | Eng | 194 for 10 in 51.0 |
| 11 | 760 | 2007 | 2574 | South Africa | 157 for 1 in 19.2 | Eng | 154 for 10 in 48.0 |
| 12 | 757 | 1996 | 1066 | Kenya | 166 for 10 in 49.3 | Win | 93 for 10 in 35.2 |
| 13 | 756 | 2011 | 3138 | South Africa | 284 for 8 in 50.0 | Bng | 78 for 10 in 28.0 |
| 14 | 743 | 2003 | 1985 | India | 292 for 6 in 50.0 | Slk | 109 for 10 in 23.0 |
| 15 | 734 | 2007 | 2561 | New Zealand | 178 for 1 in 29.2 | Bng | 174 for 10 in 48.3 |
| 16 | 734 | 2007 | 2580 | Australia | 153 for 3 in 31.3 | Saf | 149 for 10 in 43.5 |
| 17 | 733 | 1975 | 31 | Australia | 94 for 6 in 28.4 | Eng | 93 for 10 in 36.2 |
| 18 | 733 | 2007 | 2581 | Australia | 281 for 4 in 38.0 | Slk | 215 for 8 in 36.0 |
| 19 | 729 | 2003 | 1951 | Australia | 128 for 1 in 22.2 | Ind | 125 for 10 in 41.4 |
| 20 | 724 | 1992 | 719 | South Africa | 171 for 1 in 46.5 | Aus | 170 for 9 in 49.0 |
For teams to do well in the Team performance analysis, they have to be outstanding in all the departments of the game. Scores of 434 & 438/8 will not qualify because the winning team's bowling has been non-existent. 125 & 87 will not qualify because the winning team's batting has been awful. 100 & 101/1 and 300 & 50 will do very well. And the importance of the match is very significant factor.
The Australian final win in 1999 was the most devastating performance in World Cup history. Dismissing Pakistan for 132 and scoring 132/2 in 20 overs meant that there was not one ball when Pakistan was in. From 21 for 1 in 4.4 overs, Australia was in total control of the match. Even 68 for 2 took 20 overs. When Australia batted the score was 75 for no loss in 10 overs. So there is no surprise that this win leads the table with a huge rating tally of 859 points.
India's win in 1983 is ahead of the other Australian win in 2003 by a few rating points. The reason is that the winning margin of 43 is nearly 25% of the Indian total and West Indies, as a team, were far stronger than India. Indian bowling was also rated not that high. All these factors pushed India just ahead of Australia, with 818 rating points.
The Australia win in 2003 was nearly as devastating as the 1999 win. The differences are subtle. India scored 234 and that is a fair total. And at one time when India was at 130 for 3. The D/L target, unsound it was by my estimates, was close and a rain could have meant an Indian win, possibly undeservedly. In 1999 at no point was Pakistan in the game. The two Australian batting performances are similar but the 1999 bowling was better. So this performance gets 797 rating points.
In fourth position comes Sri Lanka's win over Australia in the 1996 final. A comfortable win at the end, with nearly four overs and seven wickets to spare and a top-quality opposition team pushed Sri Lanka's win to fourth position, with 783 points. The top-four performances have all been in World Cup finals.
In fifth position is the demolition of Ireland by Sri Lanka in 2007. Let us look at this. Their bowlers dismissed a reasonably strong Ireland for 77. When they won, Sri Lanka had 100% of the wicket resource left. They had 80% of the balls-resource left. This is the type of match, if played in a World Cup final would fetch 1000 rating points. Here Sri Lanka got 782 points, just one point behind their 1996 win.
Similar blitzkriegs by New Zealand, Australia, West Indies and Pakistan are in the next four positions. In tenth position is West Indies' comfortable win in the 1979 final. The last mentioned match gets 761 rating points. Thus there are five World Cup finals in the top-10. The other finals were closer matches and occupy latter positions.
My personal choices:
My personal choice for the innings of the 10 World Cups is Kapil Dev's 175. That is a situation which was so far down that any innings would have looked good. But to score 175, Kapil was indeed king. The bowling performance I would endorse would be Gilmour's 6 for 14 in the 1975 semi-final. Six top wickets, all dismissed in single figures tells the tale. The all-round performance would be Aravinda de Silva's magnificent effort at Lahore in 1996. That answered the aspirations of a small less-resourced nation. That was Sri Lanka's heyday and de Silva was the architect of that win. For this reason, his effort puts Gilmour's and Bichel's efforts into the shade.
The match of the 10 World Cups I plump for would be the Australian win over South Africa in the 1999 super-sixes match. If Australia had lost, they would not have qualified and the history of World Cup cricket could well have been different. South Africa might very well be sitting with two World Cup wins under their belts. The team performance would be India's win in the 1983 final. Most of us had to pinch ourselves that to make sure it hadn't been a dream. And for older generation like me, this was a much-loved Indian team. I never had trouble supporting this Indian team.
Anantha Narayanan has written for ESPNcricinfo and CastrolCricket and worked with a number of companies on their cricket performance ratings-related systems