Gayle and Faulkner take top positions
A look at the best batting and bowling performances from IPL 2013
S Rajesh
May 28, 2013, 1:55 PM
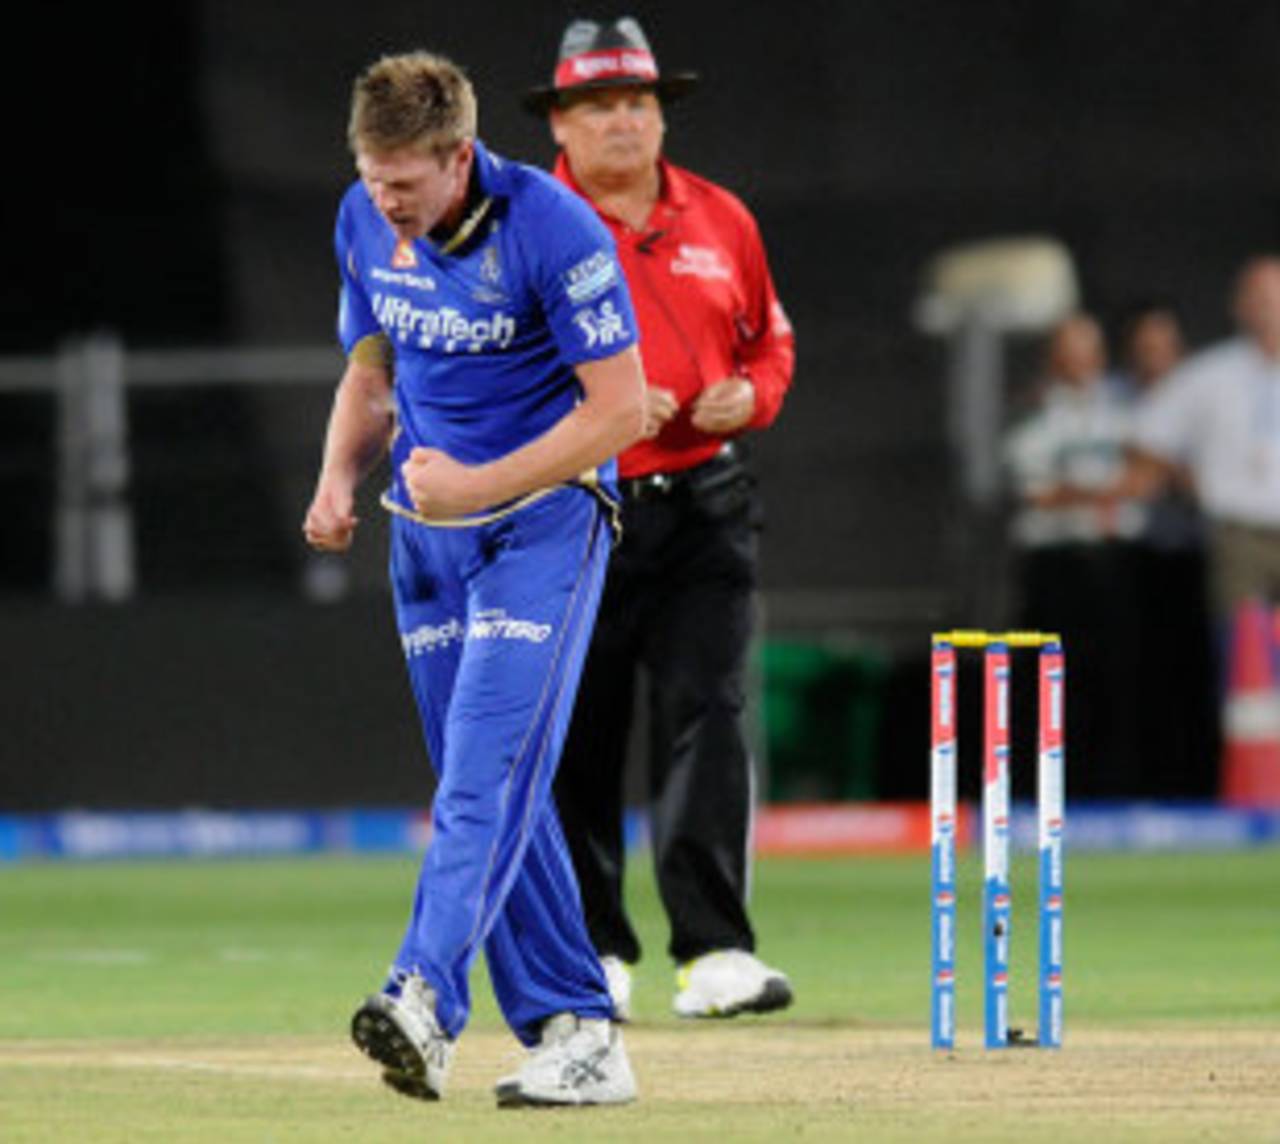
James Faulkner had the two best bowling performances of 2013, and took two of the three five-fors in the tournament • BCCI
Click here to view the overall stats and records from IPL 2013.
When Chris Gayle scored that 175 not out against Pune Warriors on April 23, in the 31st match of IPL 2013, it was unanimously believed that no batting display would come close to equalling this performance over the entire tournament. Gayle did retain the top position in terms of best batting performance, according to ESPNcricinfo's performance analysis study, but David Miller's stunning 101 not out off 38 almost stole Gayle's thunder, finishing only marginally behind Gayle in this analysis. Averaging out all performances by each batsman, Miller's average is actually a tad higher than Gayle's.
Among the bowlers, James Faulkner stood out. His 28 wickets was the second-highest of the tournament, behind Dwayne Bravo's 32, but Faulkner took two of the three five-fors in the tournament. His two five-fors, both against Sunrisers Hyderabad - 5 for 16 in Hyderabad, and 5 for 20 in Jaipur - occupy the top two slots in the best bowling performances of the tournament, while the average of all his performances is also the highest among all bowlers.
Among the individual batting performances, the innings by Gayle and Miller are well clear of the rest of the efforts in the tournament. Gayle scored 74.86 points for his 175, while Miller tallied 73.44 for his incredible effort, which came in a high run-chase after Kings XI, requiring 191, had lost four wickets for 64 in the 10th over. Thanks to Miller's effort, Kings XI ended up winning the match with two overs to spare.
The next-best effort was Shane Watson's 98 off 53 against Sunrisers, which fetched him a tally of 60.70, almost 13 fewer than Miller's score. Keiron Pollard features twice in the top six, for innings which completely changed the momentum of the games. Against Sunrisers, he came in after Mumbai Indians had slipped to 99 for 3 in the 14th over chasing 179 - he proceeded to smash 66 from 27 to take his team home with three balls to spare. His knock in the final got an even higher rating because of the low-scoring game, and because it was a final: in a high-pressure match, Pollard came in at 52 for 4 in the tenth, and scored an unbeaten 60 off 32, even as wickets kept falling at the other end. That effort won him a score of 58.16 points.
The only sub-50 effort in the top 15 is MS Dhoni's 45 off 16 against Pune Warriors, which lifted Super Kings to a match-winning total of 164. Dhoni also has two other entries, making him the only batsman with three appearances in the top 15. Suresh Raina's 100 off 53 against Kings XI is in tenth place, while the only other century in the tournament, Shane Watson's 101 off 61 in a losing cause against Super Kings, is in 18th place.
| Batsman | Innings | Strike rate | Versus | Points |
| Chris Gayle | 175* off 66 | 265.15 | Pune Warriors | 74.86 |
| David Miller | 101* off 38 | 265.79 | Royal Challengers Bangalore | 73.44 |
| Shane Watson | 98* off 53 | 184.91 | Sunrisers Hyderabad | 60.70 |
| Keiron Pollard | 60* off 32 | 187.50 | Chennai Super Kings | 58.16 |
| Brad Hodge | 54* off 29 | 186.21 | Sunrisers Hyderabad | 57.65 |
| Keiron Pollard | 66* off 27 | 244.44 | Sunrisers Hyderbad | 57.35 |
| Virat Kohli | 93* off 47 | 197.87 | Sunrisers Hyderabad | 55.38 |
| Shane Watson | 70 off 34 | 205.88 | Chennai Super Kings | 55.08 |
| MS Dhoni | 45* off 16 | 281.25 | Pune Warriors | 54.00 |
| Suresh Raina | 100* off 53 | 188.68 | Kings XI Punjab | 53.79 |
| David Miller | 80* off 41 | 195.12 | Pune Warriors | 53.58 |
| MS Dhoni | 51 off 26 | 196.15 | Mumbai Indians | 52.68 |
| Chris Gayle | 92* off 58 | 158.62 | Mumbai Indians | 52.31 |
| MS Dhoni | 63* off 45 | 140.00 | Mumbai Indians | 52.31 |
| Rohit Sharma | 79* off 39 | 202.56 | Kings XI Punjab | 51.13 |
Among the bowlers, Faulkner is the clear leader with three appearances in the top 15, including the top two performances. Jaydev Unadkat's 5 for 25 is third, not only because of the number of wickets he took, but also because he dismissed the top three batsmen in the Daredevil's line-up, and took four of the top six. Similarly, Zaheer Khan finds a place at No.6 for his 4 for 17 in the rain-curtailed match against Super Kings. He went at 8.50 per over, but it was a game in which the average run-rate was almost 12 per over, and the batsmen he dismissed were top names - Michael Hussey, Suresh Raina, MS Dhoni and Ravindra Jadeja.
Most of the bowlers in the list below are seamers, but among the spinners are Amit Mishra, for his spell of 2 for 8 against Royals, and Sunil Narine, for figures of 3 for 17 against Mumbai Indians, in which he dismissed Dwayne Smith, Sachin Tendulkar and Rohit Sharma.
| Bowler | Spell | Econ rate | Versus | Points |
| James Faulkner | 5 for 16 | 4.00 | Sunrisers Hyderabad | 61.37 |
| James Faulkner | 5 for 20 | 5.00 | Sunrisers Hyderabad | 61.11 |
| Jaidev Unadkat | 5 for 25 | 6.25 | Delhi Daredevils | 60.18 |
| Jacques Kallis | 3 for 13 | 3.25 | Sunrisers Hyderabad | 57.90 |
| Umesh Yadav | 4 for 24 | 6.00 | Rajasthan Royals | 56.90 |
| Zaheer Khan | 4 for 17 | 8.50 | Chennai Super Kings | 54.21 |
| Ali Murtaza | 3 for 15 | 3.75 | Delhi Daredevils | 53.94 |
| Mohit Sharma | 3 for 10 | 3.33 | Delhi Daredevils | 53.70 |
| Amit Mishra | 2 for 8 | 2.00 | Rajasthan Royals | 53.24 |
| Sunil Narine | 3 for 17 | 4.25 | Mumbai Indians | 52.36 |
| James Faulkner | 3 for 20 | 5.00 | Chennai Super Kings | 51.99 |
| Dhawal Kulkarni | 3 for 19 | 4.75 | Royal Challengers Bangalore | 50.61 |
| Mitchell Johnson | 2 for 8 | 2.00 | Pune Warriors | 50.29 |
| Darren Sammy | 4 for 22 | 5.50 | Kings XI Punjab | 50.00 |
| Dwayne Bravo | 3 for 9 | 3.00 | Mumbai Indians | 49.86 |
Averaging out the performances of each batsman over the tournament, it emerges that Miller's average is marginally ahead of Gayle's, with Michael Hussey, the tournament top-scorer, in third place. There's very little to separate the top five players, with Dhoni in fifth place with an average of 20.27.
| Batsman | Innings | Runs | Strike rate | Points |
| David Miller | 12 | 418 | 164.56 | 21.83 |
| Chris Gayle | 16 | 708 | 156.29 | 21.77 |
| Michael Hussey | 17 | 733 | 129.50 | 20.87 |
| Virat Kohli | 16 | 634 | 138.73 | 20.42 |
| MS Dhoni | 16 | 461 | 162.89 | 20.27 |
| Shane Watson | 16 | 543 | 142.89 | 18.80 |
| Aaron Finch | 14 | 456 | 135.71 | 17.06 |
| Suresh Raina | 17 | 548 | 150.13 | 16.40 |
| Shikhar Dhawan | 10 | 311 | 122.92 | 16.40 |
| Dwayne Smith | 13 | 418 | 122.58 | 15.99 |
Among the bowlers, Faulkner is clearly on top, with Johnson and Narine closely bunched together in second and third place. Similarly, there's little to separate Mohit and Bravo, in fourth and fifth.
The most prominent bowler missing from the list is Dale Steyn. He had an excellent tournament, taking 19 wickets at an economy rate of 5.66, but he doesn't find a place in the top ten for a couple of reasons. Though he was often outstanding with the new ball, he couldn't convert that into wickets, often beating the bat without getting the edge: of the 19 wickets he took, only five were of the top five batsmen. Eight of his victims were batsmen batting at Nos.6 and 7, and six of them were those who batted between Nos.8 and 11. Fifteen of his 19 wickets came in the last five overs of an innings.
Also, the matches that Steyn played in were generally low-scoring, which dampened his economy rate of 5.66. In the matches involving Steyn, the average economy rates of all bowlers was 6.90; in matches involving Vinay Kumar, the average was 8.15.
| Bowler | Matches | Wickets | Econ rate | Points |
| James Faulkner | 16 | 28 | 6.75 | 32.21 |
| Mitchell Johnson | 17 | 24 | 7.17 | 30.83 |
| Sunil Narine | 16 | 22 | 5.46 | 30.65 |
| Mohit Sharma | 15 | 20 | 6.43 | 28.68 |
| Dwayne Bravo | 18 | 32 | 7.95 | 28.42 |
| Ravi Rampaul | 10 | 13 | 6.92 | 27.98 |
| Harbhajan Singh | 19 | 24 | 6.51 | 27.52 |
| Vinay Kumar | 16 | 23 | 8.19 | 27.41 |
| Azhar Mahmood | 11 | 15 | 7.52 | 27.06 |
| Amit Mishra | 17 | 21 | 6.35 | 26.84 |
Salient points about the performance analysis methodology
- Each batting and bowling performance by every player in the IPL gets a score based on the runs scored and the strike rate, or the wickets taken and the economy rate.
S Rajesh is stats editor of ESPNcricinfo. Follow him on Twitter