McCullum's blitzkreig and other demolition jobs
Until now we have only looked at wins by huge number of runs or by 10 wickets as comprehensive wins
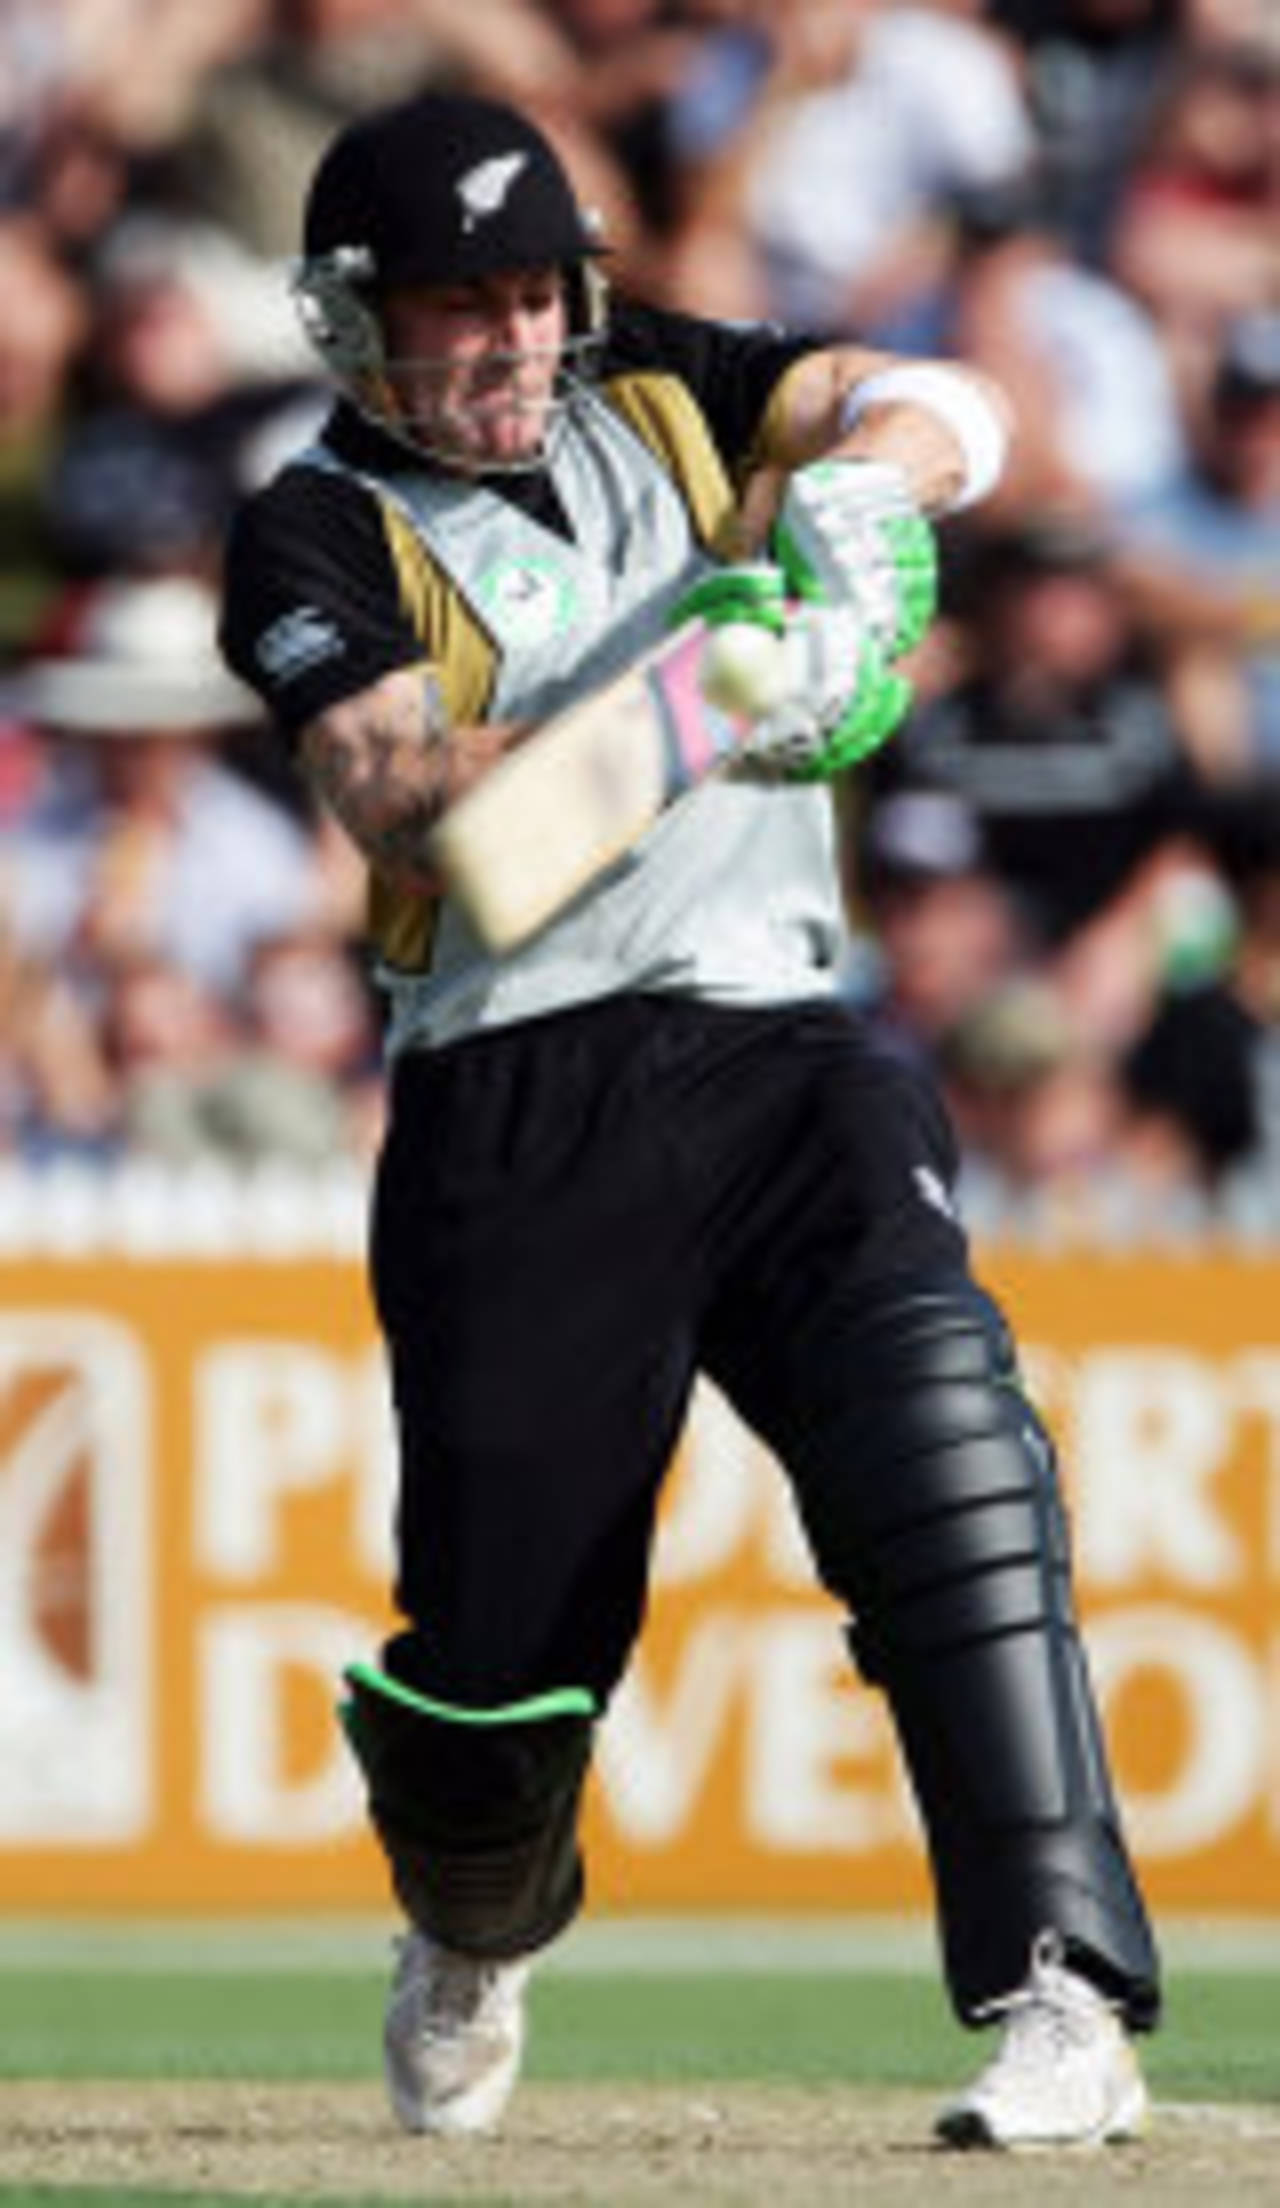
Getty Images
While I was perusing a table I found that there was an innings scoring rate of 15.83. I went back to the scorecard and saw what could be termed as the most devastating win in ODI history. I started thinking about such matches. Until now we have only looked at wins by huge number of runs or by 10 wickets as comprehensive wins. Now there is a different angle in terms of scoring rates.
This also enables us to look across both types of matches, whether teams win batting first or second. In both these matches the RpO differential is a clear indicator of the extent of domination. We should remember that a 10-wkt win need not be that dominating a victory. Imagine a team bats first and scores 200 in 40 overs. The chasing team bats very carefully and wins, say, in 45 overs by 10 wickets. This is certainly not a very comprehensive a win.
There are no qualifying conditions for this analysis. It is a very simple one of finding the RpO differential and ranking by this measure. I have separated the two tables so that we can have a clearer understanding of the win margins.
Let us look at the tables.
Big wins in ODI matches : Batting second
What happened cannot be forgotten. New Zealand scored these 95 runs in 6 overs at a rate of 15.83, the highest for an innings, by a margin of over 50%, in ODI history. McCullum scored 80 in 28 balls, the second fastest completed 50+ innings in history. The difference in RpO is 13.38. The mind goes blank.
Given below is McCullum's scoring sequence. 6x6s, 9x4s and only 7 dot balls. Makes great viewing on print and should have made greater viewing, in person. Shahid Afridi, being the only batsman with a 100+ strike rate, who I consider the most attacking batsman ever in ODI cricket would have been proud to own this innings.
4 . 4 4b . 4 6 4 6 . . 2 . 4 4 6 4 1 2 1 6 . 6 2 4 6 . 4
Look at the next entry. In terms of RpO difference, it is almost half of the first. Sri Lanka, chasing the third lowest ever ODI total of 38, reached this target in over 4 overs. McCullum might have reached in 2 overs. The blast in this match did not come from batsmen but from Vaas who took 8 for 19.
The third match is interesting. England were dismissed for 117 and then mayhem. Gilchrist and Hayden (the vintage Hayden, not the 2008 imposter) reached this target in 12 overs (including 22 boundaries).
The West Indies innings rate of 10.05, in the 12th match against Canada, is the secong highest innings scoring rate, one of only two exceeding 10.0. This was a great performance since as many as 206 runs were scored in just over 20 overs, during which 36 boundaries were scored.
Note the number of 10-wicket wins. There are 8 such wins in the top 20. Also the number of times England have been at the receiving end of such margins, four in all, sharing the lead with Bangladesh.
It is surprising that 6 of these losses have been inflicted on the top teams, England 4 times and Pakistan 2 times. Sri Lanka and South Africa lead with 4 wins each.
Big wins in ODI matches : Batting first
India has two of the most comprehensive wins in the top 5 while New Zealand also has two. But all these 5 matches are against the minnows.
The most comprehensive "relevant" win was Sri Lanka's 245 run win over India. Jayasuriya and Vaas contributed to this demolition job.
Five of the losses have been sustained by the top teams, Sri Lanka sustaining such heavy defeats thrice, all during mid-1980s. Quite a few teams, including Sri Lanka have done this thrice in the top-20 table.
Anantha Narayanan has written for ESPNcricinfo and CastrolCricket and worked with a number of companies on their cricket performance ratings-related systems