Ian Bell's No. 4 challenge
Before Pietersen came along, England had struggled for prolific No. 4 Test batsmen since the mid-1970s. Can Bell step up to the plate?
S Rajesh
23-May-2014
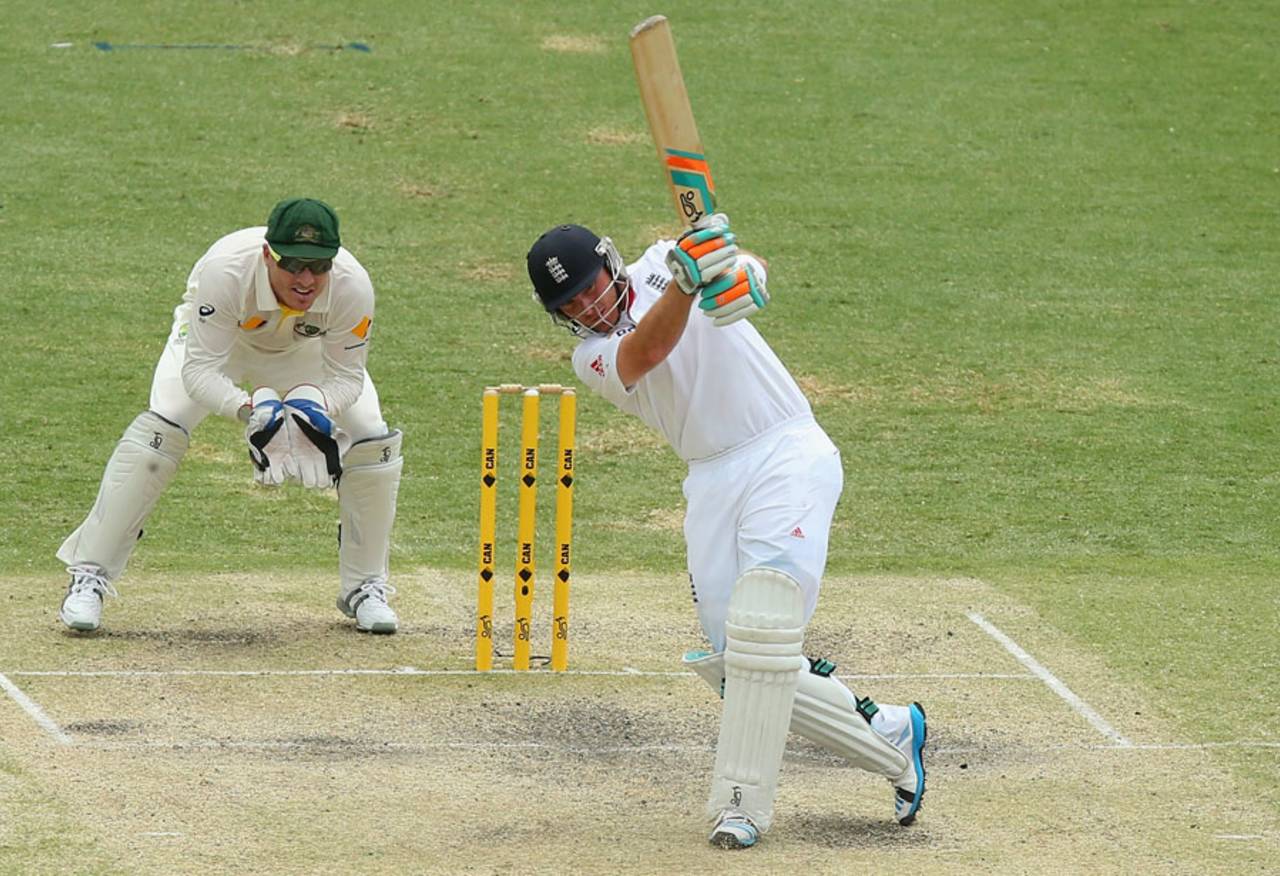
Ian Bell has scored heavily when batting at Nos. 5 and 6; can he be as prolific at No. 4? • Getty Images
In the last seven months, more than one team has had to deal with the retirement of a legendary No. 4 batsman. Sachin Tendulkar played his last Test match in November last year, while Jacques Kallis quit Test cricket a month later. Both India and South Africa found the players they were going to back for that spot pretty quickly; it's now England's turn to do the same.
Kevin Pietersen's time with England was marked by several controversies off the field, but on it there's little doubt that he was a colossus. He didn't finish with a 50-plus average, unlike Tendulkar or Kallis, but he was clearly one of the greatest England have had: his tally of 8181 runs is the fourth-best for England, and his 23 Test centuries is the second-best among England batsmen. Nineteen of those hundreds, and 6490 of his Test runs, came at No. 4. Add his sheer presence at the crease, and a strike rate of more than 62, and it's a package that won't be easy to replace.
Luckily for England, though, they have a batsman who's primed for the slot. India opted for Virat Kohli and South Africa Faf du Plessis, both batsmen with limited Test-match experience, but Ian Bell has already played 98 Tests. He has mostly batted at Nos. 3, 5, or 6, but there's no reason why he should not make a success of No. 4. His current career stats, though, suggest he's been more comfortable batting lower down the order in his career so far: he averages 38.43 at Nos. 3 or 4, and 52.29 at Nos. 5 or 6. For much of his career, Bell was happy to bat in the slipstream of a more dominant player, and for Pietersen he was the perfect foil: in fact, Bell and Pietersen scored 3028 partnership runs in Tests, almost twice as many as Bell has scored with any other batsman. However, in the last few years, Bell has taken on a more dominant role in the batting order - perhaps never more prominently than in the 2013 Ashes - and looks set for higher responsibilities.
Bell's situation is somewhat similar to that of Michael Clarke, who had played 86 Tests at the time of Ricky Ponting's retirement, but had batted at No. 4 only 28 times until then, averaging 20.92; since Ponting's retirement, Clarke has averaged 49.82 in 19 innings at No. 4. The contrast between the numbers at No. 4 and No. 5 isn't so acute for Bell, who also has far more experience of batting in the top order - since he has come in one-down as well - than Clarke had when Ponting retired.
| Position | Inngs | Runs | Average | Strike rate | 100s/ 50s |
| No. 3 | 38 | 1453 | 39.27 | 50.82 | 2/ 10 |
| No. 4 | 25 | 853 | 37.08 | 42.50 | 2/ 7 |
| No. 5 | 60 | 2461 | 48.25 | 47.74 | 9/ 11 |
| No. 6 | 37 | 1618 | 59.92 | 56.43 | 6/ 9 |
Bell, or whoever England decide to play at No. 4, will have big shoes to fill. In the last four decades, England haven't had anyone nearly as prolific as Pietersen was at that slot: he averaged 48.43 at that position; the next-best was Graham Thorpe, who averaged 41.72. Then there were several others who averaged in the late 30s, including Robin Smith, David Gower, Allan lamb and Nasser Hussain.
One of the problems for other No. 4 batsmen from England was converting their 50s into centuries: Gower, for instance, had 20 fifties but only three hundreds, an incredibly poor conversion ratio for a No. 4 batsman. Pietersen, on the other hand, had 46 scores of more than 50 of which 19 were centuries. No other batsman in the list below has even half that number.
The other aspect about Pietersen's batting that stood out was his strike rate: he scored an average of 62 runs per 100 balls, while none of the other batsmen in the list below touched 50. When in form, his ability to attack bowlers and put them on the back foot eased the pressure on other batsmen too.
| Batsman | Innings | Runs | Average | Strike rate | 100s/ 50s |
| Kevin Pietersen | 139 | 6490 | 48.43 | 62.40 | 19/ 27 |
| Graham Thorpe | 73 | 2712 | 41.72 | 47.16 | 4/ 18 |
| Robin Smith | 49 | 1834 | 39.86 | 46.97 | 5/ 10 |
| David Gower | 91 | 3223 | 38.36 | 45.74 | 3/ 20 |
| Allan Lamb | 67 | 2340 | 38.36 | 49.50 | 8/ 7 |
| Nasser Hussain | 82 | 2877 | 37.36 | 41.72 | 8/ 17 |
| Ian Bell | 25 | 853 | 37.08 | 42.50 | 2/ 7 |
| Mike Gatting | 29 | 906 | 34.84 | 47.60 | 2/ 5 |
| Michael Vaughan | 30 | 882 | 32.66 | 44.05 | 2/ 5 |
During the period that Pietersen manned England's No. 4 spot - from 2006 onwards - they averaged a healthy 46.22. Pietersen played 139 out of 177 innings, and struck 19 out of England's 21 centuries at that position. (The other two hundreds were scored by Paul Collingwood and Jonathan Trott.) South Africa and Sri Lanka are the only sides whose No. 4s have averaged more than 50 during this period, and what stands out for both these teams is their conversion rate - they've both scored more centuries than fifties. Pakistan haven't done badly either with 17 hundreds and 19 fifties, and an average of 49.88.
| Team | Innings | Runs | Average | Strike rate | 100s/ 50s |
| Sri Lanka | 124 | 6055 | 52.65 | 51.92 | 21/ 17 |
| South Africa | 136 | 6246 | 50.37 | 50.33 | 25/ 20 |
| Pakistan | 119 | 5338 | 49.88 | 52.30 | 17/ 19 |
| India | 154 | 7012 | 49.03 | 54.14 | 18/ 37 |
| England | 177 | 7858 | 46.22 | 56.67 | 21/ 35 |
| New Zealand | 121 | 4691 | 42.64 | 54.55 | 12/ 22 |
| Australia | 163 | 5658 | 37.72 | 48.64 | 15/ 27 |
| West Indies | 122 | 3899 | 33.61 | 47.00 | 8/ 20 |
| Bangladesh | 84 | 2129 | 26.94 | 49.70 | 4/ 7 |
Pietersen's exploits improved England's No. 4 stats considerably, for before he came along, their numbers had been quite poor, going back all the way to the mid-1970s. Since 2006, England's No. 4s averaged 46 in 102 Tests, but in 103 Tests before that - in the eight-year period between 1998 and 2005 - they averaged 34.93, which was worse than all teams except Zimbabwe and Bangladesh. In 183 innings they managed only 14 hundreds (one every 13 innings), compared to 21 in 177 (one every 8.4 innings) during the Pietersen era.
Before the mid-1970s, England had several top-class No. 4 batsmen: Ken Barrington, Peter May, Denis Compton and Wally Hammond all scored 2000-plus runs at 50-plus averages, while Mike Denness averaged 49.90. However, Denness played his last Test in 1975. Since then and before Pietersen, England had a long period when their No. 4s weren't as prolific as those from other teams. In the period between 1976 and 1997, their average of 35.25 was worse than all teams except South Africa. Their record of 22 hundreds in 398 innings converts to one every 18 innings, compared to Pakistan's average of one every 8.5 innings.
| 1998 to 2005 | 1976 to 1997 | |||||
| Inngs | Average | 100s/ 50s | Inngs | Average | 100s/ 50s | |
| India | 129 | 60.24 | 23/ 25 | 287 | 44.44 | 31/ 58 |
| South Africa | 150 | 59.24 | 27/ 36 | 72 | 33.98 | 4/ 13 |
| Sri Lanka | 125 | 48.70 | 14/ 25 | 140 | 40.16 | 18/ 20 |
| West Indies | 157 | 47.70 | 20/ 32 | 285 | 38.31 | 24/ 51 |
| Pakistan | 125 | 46.66 | 15/ 26 | 265 | 48.17 | 31/ 49 |
| Australia | 164 | 43.17 | 17/ 30 | 389 | 43.30 | 36/ 83 |
| New Zealand | 113 | 35.11 | 4/ 27 | 253 | 38.51 | 22/ 43 |
| England | 183 | 34.93 | 14/ 33 | 398 | 35.25 | 22/ 74 |
| Zimbabwe | 113 | 26.92 | 3/ 15 | 41 | 46.10 | 4/ 5 |
| Bangladesh | 79 | 20.55 | 1/ 7 | - | - | - |
Among the No. 4 batsmen who've scored at least 2000 Test runs since the beginning of 1976, 12 batsmen have higher averages than Pietersen's 48.43, and among those 12 there's at least one batsman from each of the other top seven countries. Australia have Greg Chappell and Allan Border, Pakistan have four - Javed Miandad, Inzamam-ul-Haq, Mohammad Yousuf and Younis Khan - while Tendulkar and Kallis are the Indian and South African representatives. Mahela Jayawardene, Brian Lara, Ross Taylor and Martin Crowe complete the list, with all except Crowe averaging more than 50.
Pietersen did a fantastic job at No. 4 over eight years, but with that era now over, England will be hoping they don't go back to the pre-Pietersen period of underperforming No. 4s. Ian Bell has a significant challenge on his hands, but, given his recent record, he also has the skill and the temperament to make a success of it.
| Batsman | Inngs | Runs | Average | 100s/ 50s |
| Greg Chappell | 36 | 2004 | 64.64 | 6/ 10 |
| Jacques Kallis | 170 | 9033 | 61.86 | 35/ 36 |
| Mohammad Yousuf | 63 | 3416 | 56.93 | 11/ 13 |
| Younis Khan | 58 | 2671 | 54.51 | 8/ 12 |
| Sachin Tendulkar | 275 | 13,492 | 54.40 | 44/ 58 |
| Javed Miandad | 140 | 6925 | 54.10 | 19/ 31 |
| Inzamam-ul-Haq | 98 | 4867 | 52.90 | 15/ 21 |
| Mahela Jayawardene | 184 | 9040 | 52.86 | 29/ 31 |
| Brian Lara | 148 | 7535 | 51.25 | 24/ 31 |
| Ross Taylor | 80 | 3639 | 51.25 | 10/ 17 |
| Allan Border | 88 | 3783 | 50.44 | 8/ 21 |
| Martin Crowe | 106 | 4841 | 49.39 | 16/ 16 |
S Rajesh is stats editor of ESPNcricinfo. Follow him on Twitter